In a presentation at MDM’s Pricing & Profitability Summit earlier this year, Randy MacLean, president of WayPoint Analytics, questioned distributors’ broad use of gross margin as a business performance benchmark. His premise: Widespread misuse of gross margin is the most common dysfunction in wholesale distribution. “Gross margin isn’t enough to understand what’s going on,” MacLean said.
Many distributors are still stuck in the gross margin mindset, but leading companies are realizing they would be better off shifting their focus to their bottom line, he said.
“Understanding where you’re making and losing money makes all the difference in the word. Because then you can focus on the things that are making money and you can get away from the things that are losing you money,” MacLean said during the session, How New Analytics Are Producing Super-Profitable Companies. “That differential is huge.”
The best way to start recognizing these true dynamics of a business is to plot profits on a whale curve, MacLean offered. Whale curves rank profits of any category of the business, such as customers or specific product sales, stacking them from most profitable to least profitable — the money losers making up the tail of the whale.
In a real-life example, MacLean showed how one distributor’s whale curve revealed the company was bringing in $5.5 million as its peak internal profit, but then losing most of it from profit-draining clients. [See chart below.] This particular company’s realization, or amount of profit the distributor kept, was better than most at about 27%. Most distributors see a 20%-25% profit realization on average, he said.
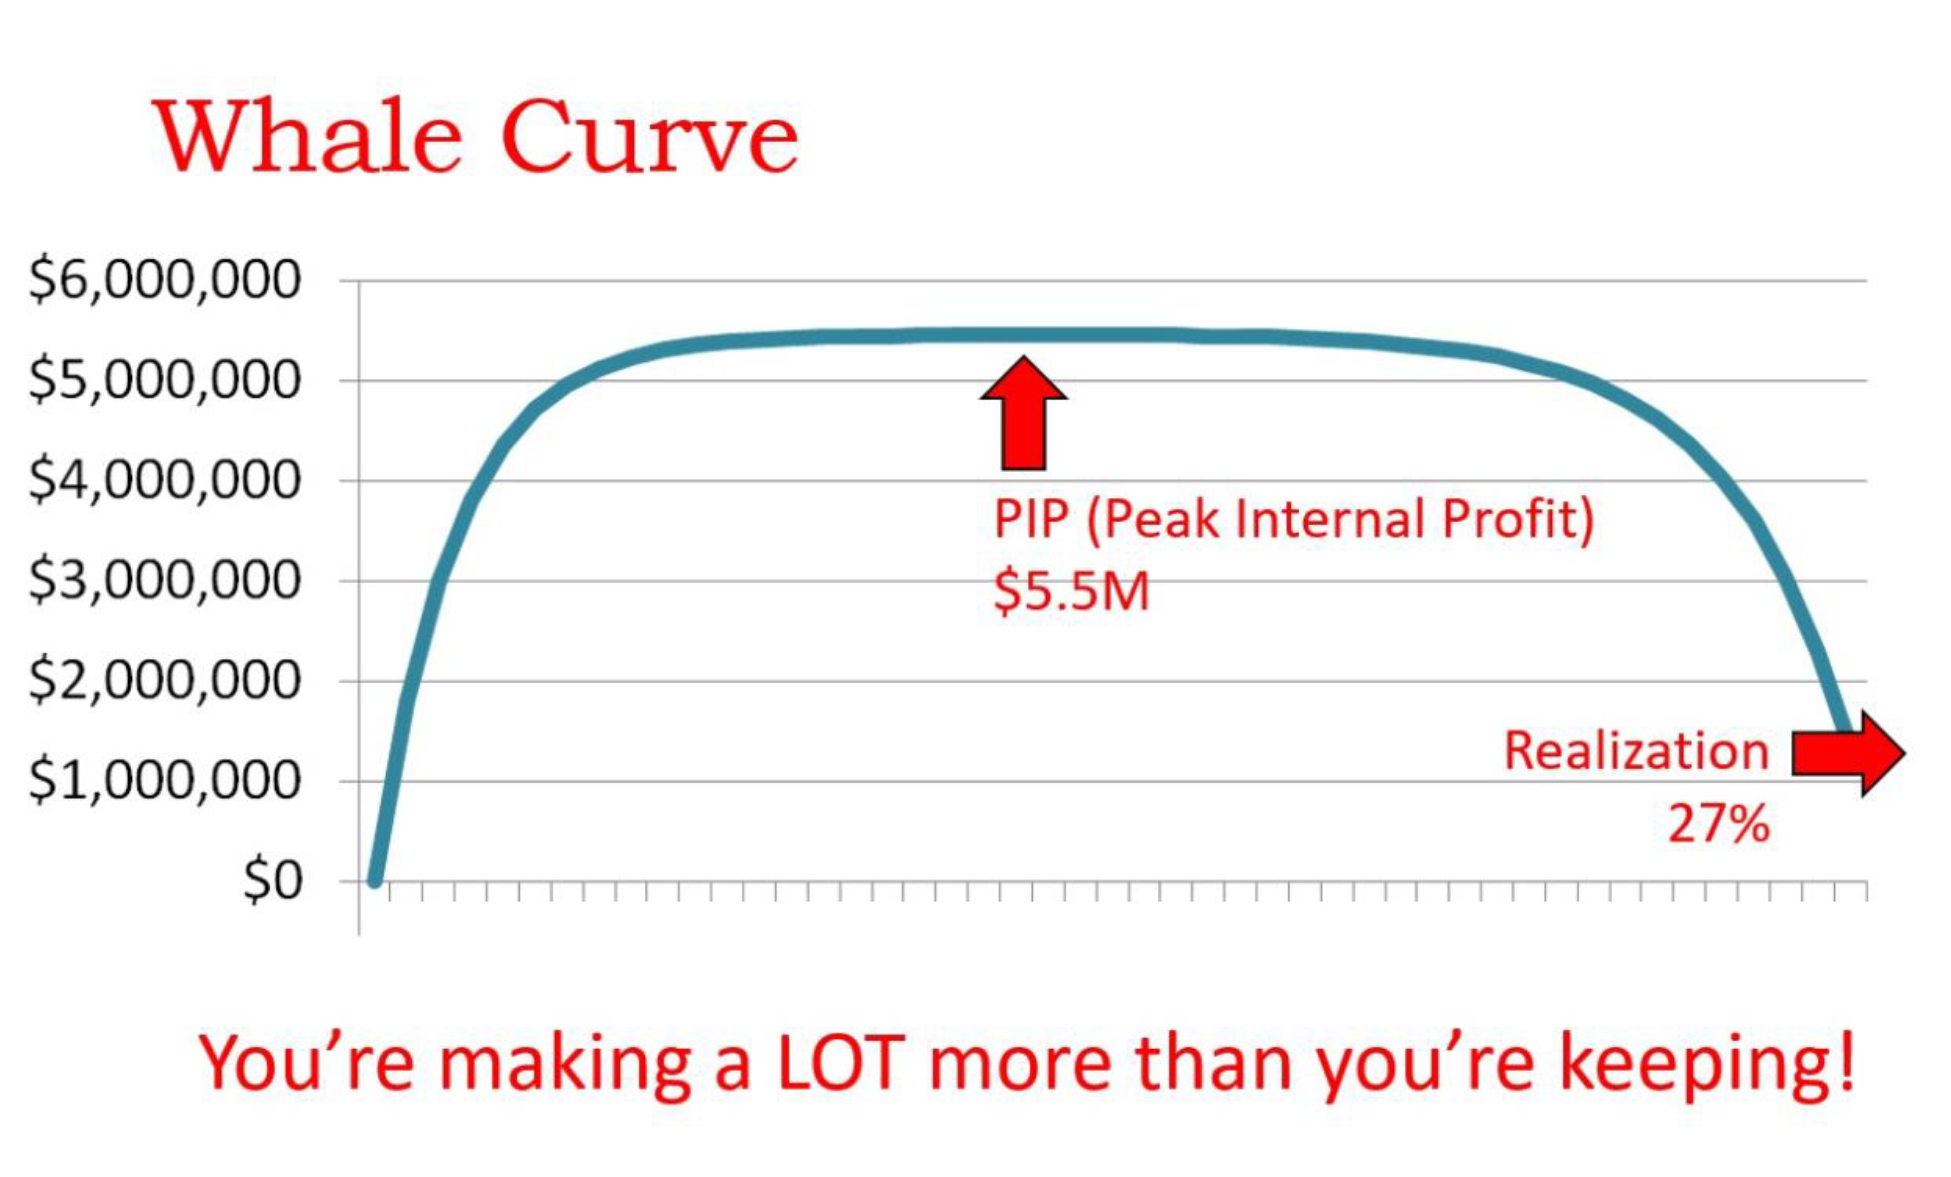
Every company has a whale curve and the only difference among them, MacLean said, is whether or not the tail ends up above or below zero dollars. “You’re sitting on loads of profits and then basically paying people to load them onto trucks and ship them out to other customers,” he quipped. “If you can stop doing that, you can make a huge difference within the selling envelope you have right now. That is the key.”
To improve the profitability of their whale curve, distributors would be wise to take a look at where they’re making and losing money to focus more on their strengths and reduce the amount of business they’re doing where they’ve had problems. By taking these actions, MacLean said, one distributor quadrupled its bottom line in one year. By the second year, they had six times the bottom line. “They started to understand what the dynamics were and started to manage the dynamics. They set themselves apart from the competition because the competitors were doing things the way they’d always been done before.
Shocking Losses
All distributors know that they have both money-making and money-losing invoices but the vast majority underestimate the latter. When MacLean launched WayPoint about 10 years ago and started getting into the analytics, he estimated distributors have about 15%-18% unprofitable business. But what he’s found in the ensuing decade is that across distribution 62.5% of all invoices are money losing. “That is shocking,” he said.
The reason distributors can stay in business with such a high portion of unprofitable invoices is because they make so much money on the other 37.5% of invoices that are profitable. What does that mean? “You are pricing your best customers far, far, far above what you should be in order to subsidize the losers,” MacLean explained.
Being aware of this imbalance and putting a plan in action to lessen it is leading to “the emergence of a new kind of company in the marketplace across the last 10 years,” he said. One of the strongest correlations he’s found for successful distributors is the proportion of money-losing invoices they allow to go through their organization.
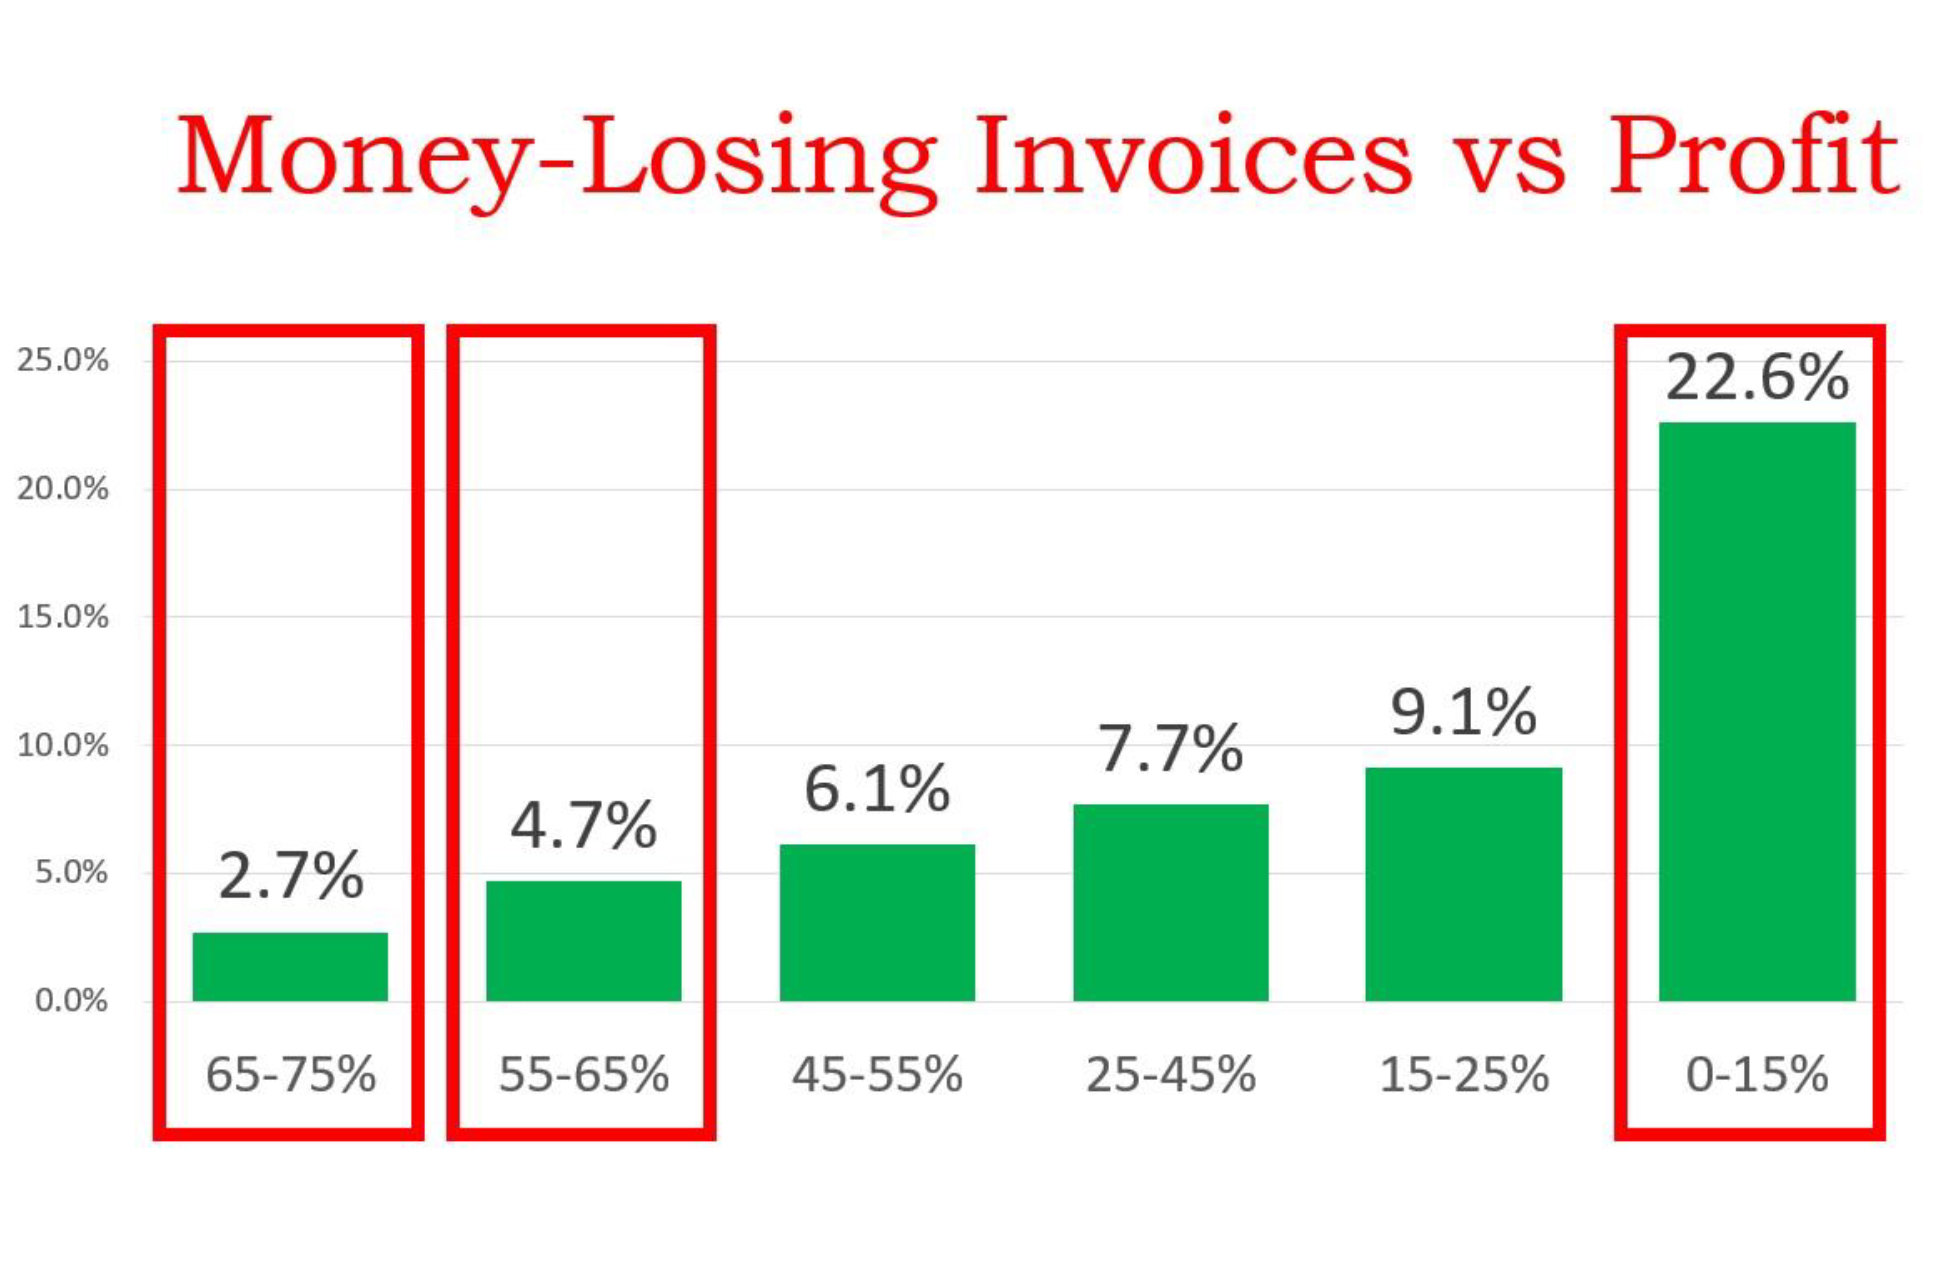
Distributors with 65%-75% money-losing invoices have an average net profit rate of 2.7%. By contrast, those that only bring in 0%-15% money-losing invoices have an average net profit rate of 22.6%. [See chart below] MacLean refers to these latter distributors as “super performers,” able to succeed because of the emergence of technology in the last decade that allows them to track and analyze their data more effectively.
Transforming money-losing invoices into profitable ones doesn’t involve changing sales to customers but rather adjusting the nature of how distributors do business with those companies, MacLean said. For example, cutting down on the number of small invoices for small amounts of product with a lot of overhead costs within an account can reduce expenditures. By making these types of adjustments, one distributor was able to find approximately $150,000 worth of profit opportunity from existing clients within a sales territory.
The Problem with Margins
When conducting a profitability analysis, MacLean said average revenue per invoice can be a good starting place as a rule of thumb measure for evaluating the relative value of an account. Using one distributor’s customer profit ranking as an example, MacLean pointed out that customer margins tend to be all over the board (for his example distributor, those margins were between 15.1% and 37.1%). Because of this spread, margins are not a good indicator of overall profit stemming from each customer account. “You can’t make judgments based on margin, because if you do, you’re going to get the wrong answer almost all the time,” MacLean explained.
Expenditures, by contrast, are the best measure of the efficiency of the customer relationship. “That shows how little you expend for how much you get on an account. If you have that number, you have the key to almost everything in the relationship. It’s very, very important,” he said.
To make a lot of money, distributors have to have a lot of operating cash coming in from accounts. Distributors should consider thinking of gross profit not as an accou nting term but rather how much money they have to spend, MacLean added.
These factors tie into a distributor’s pricing strategy, which in turn is vital to what kinds of customers they attract, services they provide and who they are in their community. The key, he said, is not to price products but rather be customer-centric. It’s a hard concept for distributors to internalize, as they focus on selling product, marketing product, advertising product, moving product and inventorying product. But, as an example of why pricing based on product alone doesn’t work, MacLean shared how one distributor had 36.4% margin, making $899 on $5,361 worth of revenue on one product from one of its customers. The same distributor was selling the same product to another customer with 36.9% margin but losing $3,228 on it in the process.
“Our biggest money maker and our biggest money loser on this one product have the same margins because margin has nothing to do with profitability,” he said. “The profitability of the product has everything to do with who purchases it and how they purchase it.”
This blog is No. 3 of MDM’s 10 Most-Read Blogs of 2019. Each week as the year winds down, we will share these most popular posts until we reach No. 1. View No. 4, 5, 6, 7, 8, 9 and 10.
MDM wants to hear from you! Please comment below or email us at info@mdm.com.
Related Posts
-

Materially changing market conditions caused by the COVID-19 pandemic have impacted the companys previously announced…
-
Smartrac is a leading innovator in the development and manufacture of RFID inlays.
-

The transaction was completed in a single closing and resulting in cash proceeds to Hillenbrand…