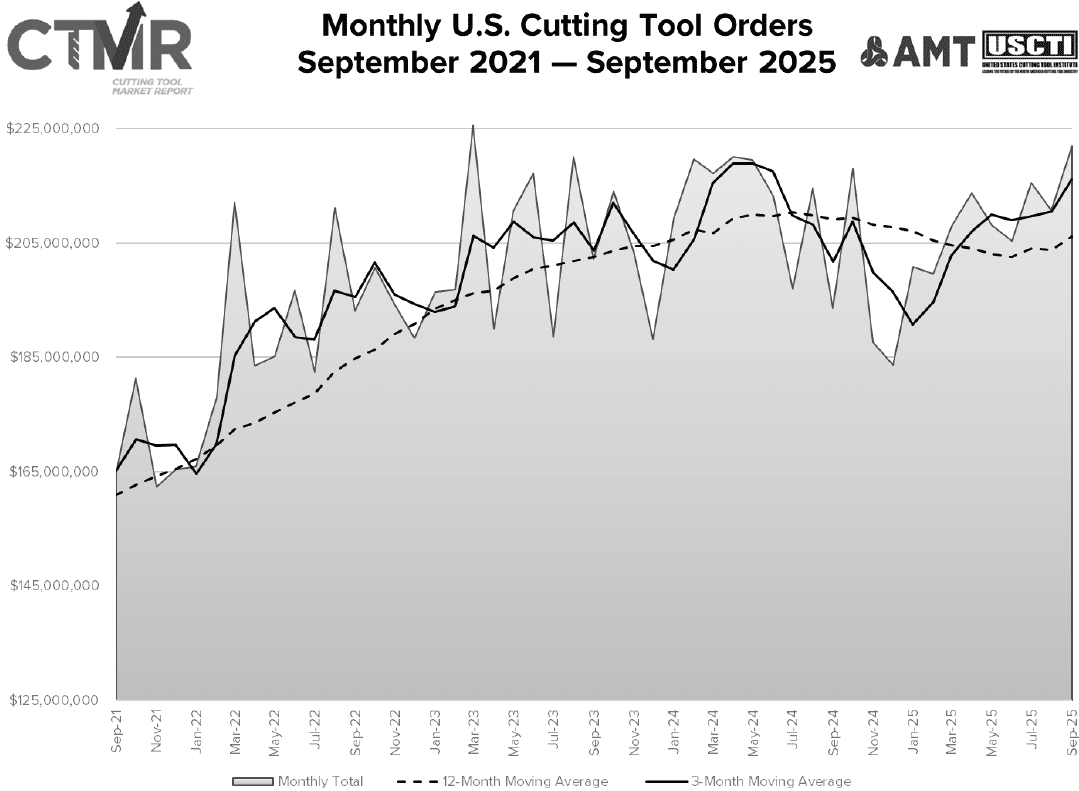
September 2025 U.S. cutting tool consumption totaled $222 million, according to the latest Cutting Tool Market Report (CTMR) published by the U.S. Cutting Tool Institute (USCTI) and the Association for Manufacturing Technology (AMT).
That total increased 5.3% month-to-month and 14.7% year-over-year, following declines of 2.7% and 1.8%, respectively, in August.
Year-to-date through September, shipments totaled $1.88 billion, down 1.1% from a year earlier.
“Most users remain concerned about their backlog, future orders and inventory, especially for the transportation sectors of manufacturing,” said Jack Burley, Chairman of AMT’s Cutting Tool Product Group and President of cutting tool manufacturer Big Daishowa. “For September, cutting tool deliveries were normal, and some optimism that unstable business conditions may be improving was tempered by the higher cost of products and lower profitability. Unit prices for most cutting tools are up by double digits due to price hikes caused by tariffs and increased costs for raw materials. I don’t expect to see any improvements in the fourth quarter.”
“Even more encouraging is that the third quarter, as a whole, surpassed the third quarter of 2024, suggesting that this budding positive momentum is not a one-month fluke,” added Michelle Kocses, Senior Economist at ITR Economics. “Buttressing this rise, U.S. industrial production is in an accelerating growth trend. Capex is beginning to pick up as confidence gradually improves, but there are soft spots in oil and gas drilling and heavy truck markets. Forward-looking evidence points to measured optimism for 2026.”
The Cutting Tool Market Report is jointly compiled by AMT and USCTI, two trade associations representing the development, production and distribution of cutting tool technology and products. It provides a monthly statement on U.S. manufacturers’ consumption of the primary consumable in the manufacturing process — the cutting tool. Analysis of cutting tool consumption is a leading indicator of both upturns and downturns in U.S. manufacturing activity, as it is a true measure of actual production levels.
The graph below includes the 12-month moving average for the durable goods shipments and cutting tool orders. These values are calculated by taking the average of the most recent 12 months and plotting them over time. Click on the chart for a larger version.
Related Posts
-

Consumption increased during March 2025 trail year-ago levels, reflecting persistent year-over-year declines.
-

August U.S. cutting tool stats suggest continued market uncertainty.
-

U.S. cutting tool consumption rose modestly in April but remains down year-over-year, as market uncertainty…