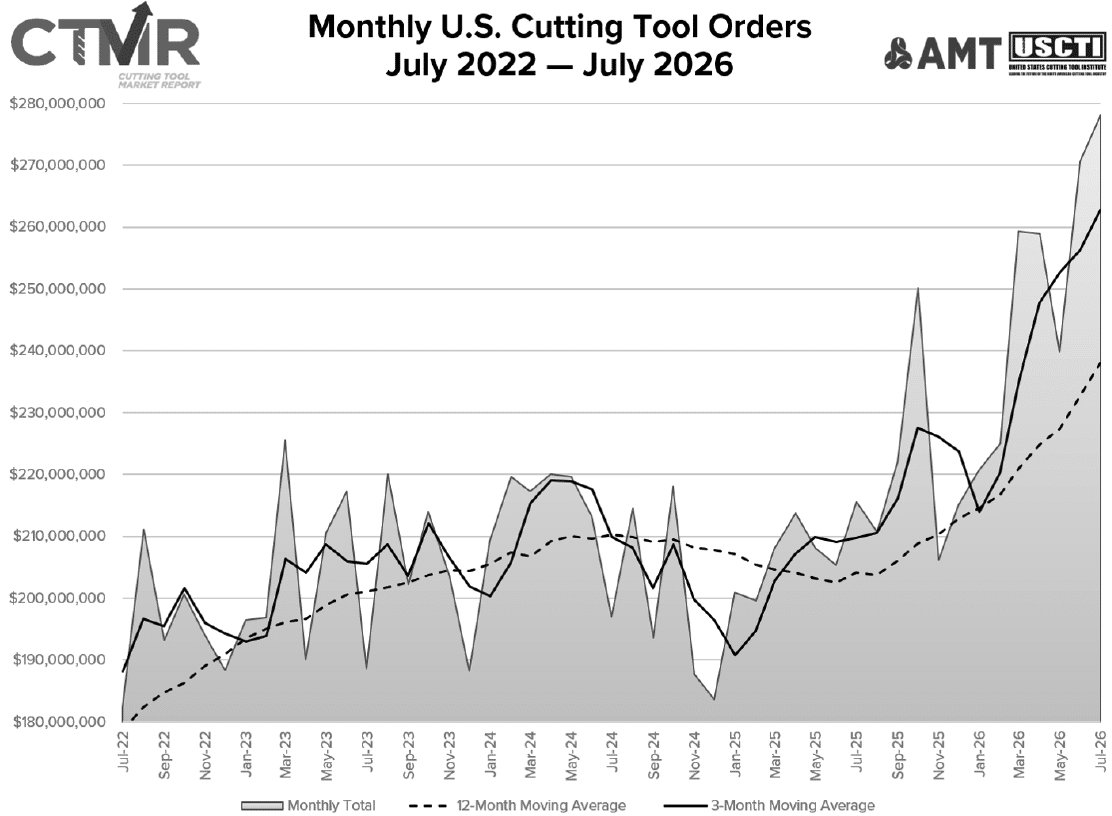
The value of July U.S. cutting tool shipments totaled $278.1 million, setting a new monthly record, according to the latest Cutting Tool Market Report (CTMR) published Sept. 15 by the U.S. Cutting Tool Institute (USCTI) and the Association for Manufacturing Technology (AMT).
That figure was up 2.8% from June and 29% year-over-year. Year-to-date shipments through July totaled $1.75 billion — up 20.7% from the same period in 2025. Unit shipments, meanwhile, held steady from June.
The July results extended the sharp growth reported a month earlier, when June shipment value jumped 12.8% from May and 31.7% year-over-year to $270.5 million.
Jack Burley, Chairman of AMT’s Cutting Tool Product Group and President of cutting tool manufacturer Big Daishowa, said consumption remains elevated as manufacturers work through backlogs and incoming orders. He added that the ongoing carbide supply crunch has pushed user costs up by double digits, particularly for larger tools.
Those higher costs, combined with strong demand, helped July surpass June as the highest monthly shipment total on record. Burley said he expects the trend to continue through the remainder of 2026 and into 2027, while prompting manufacturers to consider alternatives to solid carbide tooling, including replaceable carbide heads.
Michelle Kocses, Senior Economist at ITR Economics, characterized cutting tool shipment growth as robust but cautioned that it is occurring in an inflationary environment.
Manufacturing demand also remains uneven, she said, with legacy markets such as automotive stagnating while high-tech and defense markets are booming. Kocses expects the durable goods inventory cycle to wind down in 2027 and said consumer markets could remain restrained by weak real incomes and elevated borrowing costs.
The Cutting Tool Market Report is jointly compiled by AMT and USCTI and tracks U.S. manufacturers’ consumption of cutting tools. Cutting tool consumption is considered a leading indicator of U.S. manufacturing activity because it reflects actual production levels.
The graph below includes the 12-month moving average for durable goods shipments and cutting tool orders. These values are calculated by taking the average of the most recent 12 months and plotting them over time.