
All charts by U.S. Bureau of Economic Analysis. Click on charts for hi-res version.
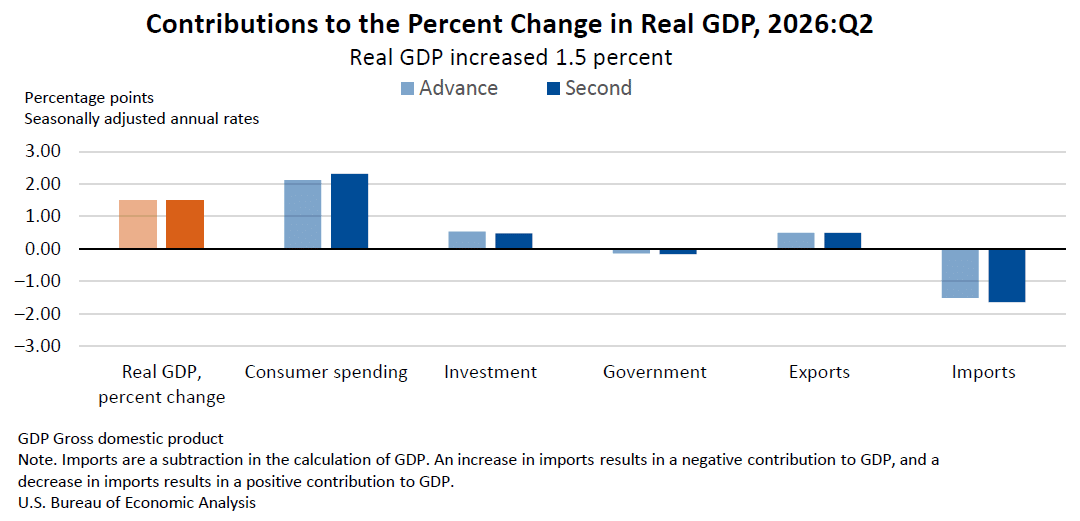
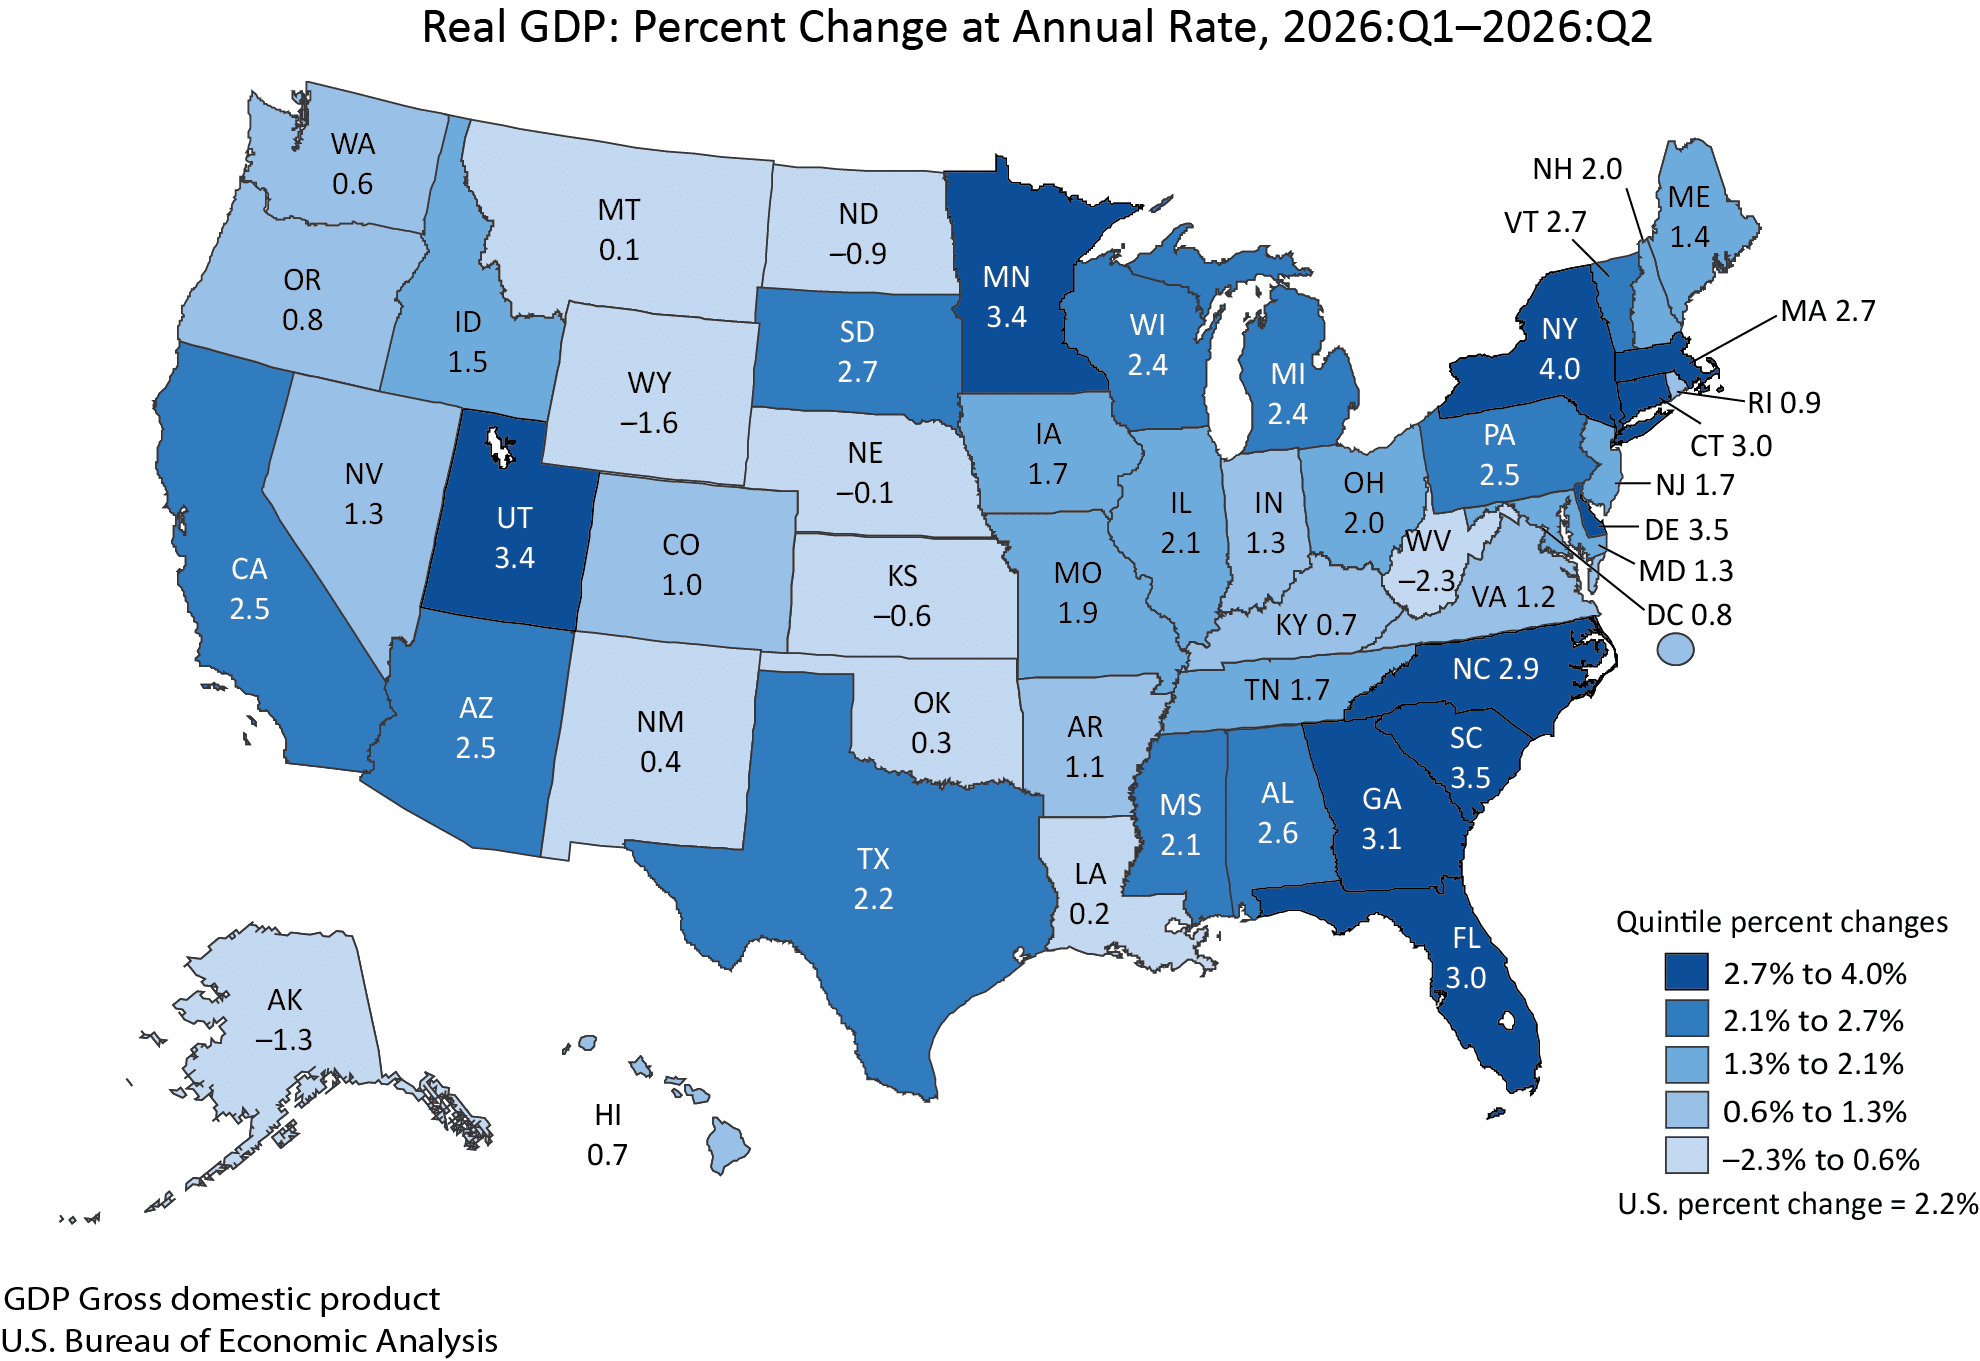
The U.S. economy expanded at a 2.2% annual rate in April-June, according to the Bureau of Economic Analysis’ third estimate released Sept. 30. Consumer spending, investment and exports supported growth, while rising imports weighed on the calculation.
The result exceeded the 1.5% growth reported in both earlier estimates. BEA’s August update had left overall growth unchanged, with stronger consumer spending partly offset by higher imports.
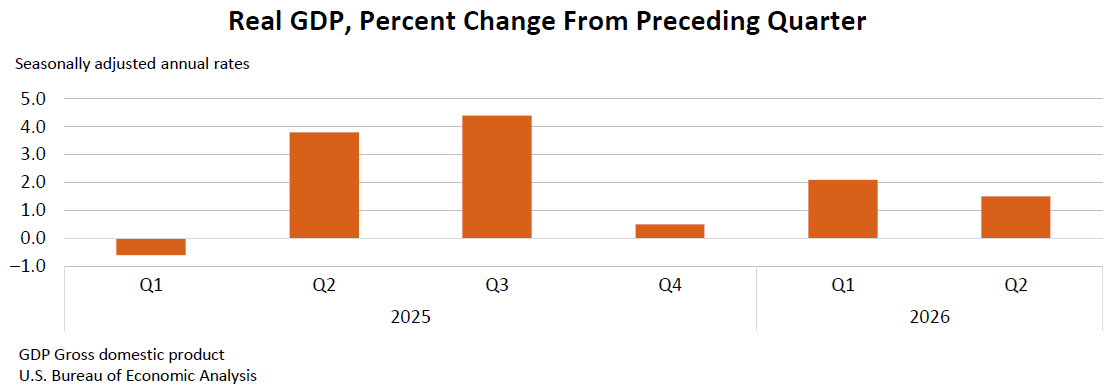
BEA also raised 1Q growth to 2.5% in its annual update, from the 2.1% reported in June. Second-quarter growth therefore remained slower.
The 0.7-percentage-point upgrade reflected higher investment, consumer spending and government spending. Wholesale inventories helped drive the investment revision, alongside data center construction and residential improvements.
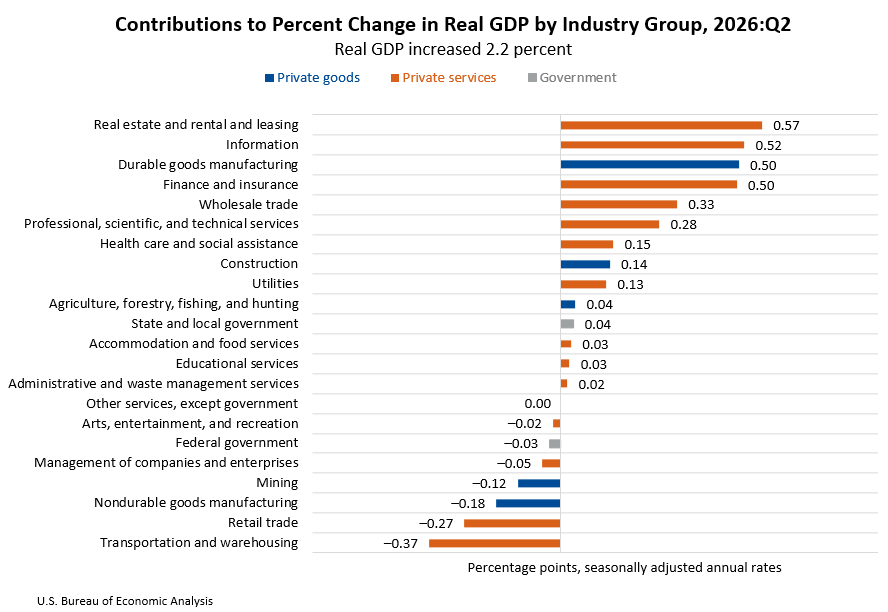
Leading industry contributors included real estate, information, durable goods manufacturing and finance and insurance. Transportation and warehousing, retail trade and nondurable goods manufacturing were the leading offsets.
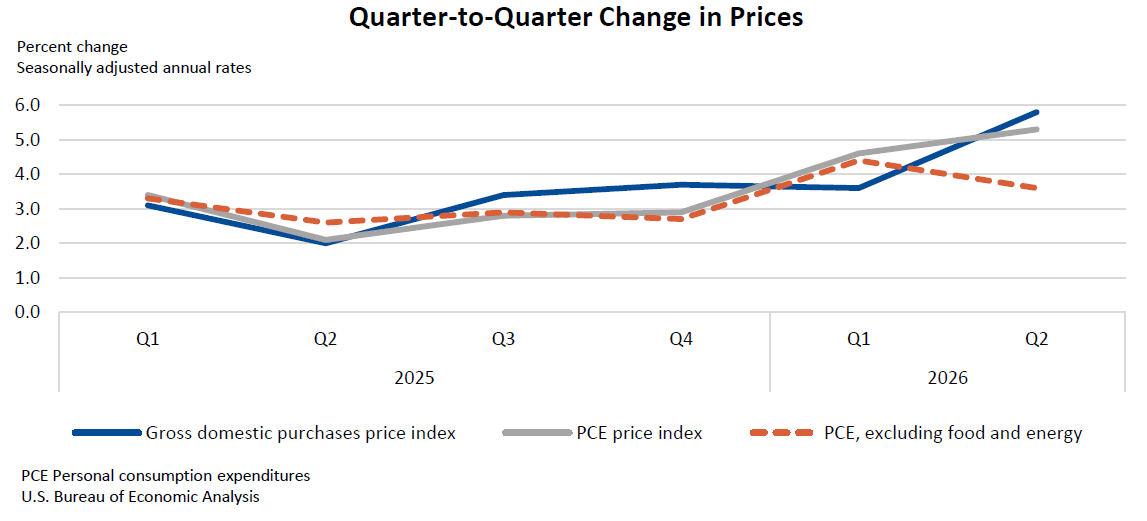
Real final sales to private domestic purchasers — consumer spending plus gross private fixed investment — rose 4.6%, versus August’s 4.2% estimate. Inflation measures were revised lower, as detailed below.
MDM Analysis
For distributors, the stronger private-demand reading is encouraging, but inventory revisions warrant a separate look. Higher inventory investment alone does not establish whether goods are moving through the channel faster or accumulating ahead of demand.
The practical test is whether customer orders, inventory turns and project activity support the improved national picture. Distributors should also distinguish price-driven sales gains from volume growth: Lower inflation estimates still show substantial price increases, which can make nominal revenue performance look stronger than underlying demand.
Real GDP and Related Measures
Percent change from 1Q26 to 2Q26, seasonally adjusted at annual rates.
| Measure | 2Q 1st Estimate | 2Q 2nd Estimate | 2Q 3rd Estimate |
|---|---|---|---|
| Real GDP | 1.5% | 1.5% | 2.2% |
| Current-dollar GDP | 7.9% | 8.0% | 8.5% |
| Real final sales to private domestic purchasers | 3.9% | 4.2% | 4.6% |
| Gross domestic purchases price index | 5.7% | 5.8% | 5.6% |
| PCE price index | 5.1% | 5.3% | 5.0% |
| PCE price index excluding food & energy | 3.4% | 3.6% | 3.3% |
Related Posts
-

The U.S. economy grew slower in early 2026 than first reported, as downward revisions to…
-

The headline figure came in below expectations as rising imports and weaker government spending weighed…
-

The U.S. economy grew faster in early 2026 than previously reported, but the upward revision…