December U.S. cutting tool shipments totaled $215 million according to the latest Cutting Tool Market Report (CTMR) published by the U.S. Cutting Tool Institute and the Association for Manufacturing Technology (AMT).
That total increased 4.3% from November and 17.1% year-over-year. For the full year, 2025 shipments totaled $2.56 billion for a 2.5% annual gain.
“Growth in the aerospace and automotive sectors indicates cutting tool demand should continue the gains seen during the last quarter of 2025 through at least the first half of 2026,” Alan Richter, Editor-at-Large Cutting Tool Engineering, said in the monthly CTMR report. “The upcoming IMTS Show in Chicago will stimulate positive activity for the second half of the year.
Eli Lustgarten, president of ESL Consultants, added: ”2025 marked the fifth straight year of higher orders since the trough in 2020. The ISM Manufacturing index signaled expansion for the first time in 12 months in December 2025. Cutting tool demand is likely to improve by about 5% to 10% in 2026, with lagging unit sales finally catching up to dollar-sales growth. Aerospace and defense should remain strong; data centers and energy are projected to be robust; and construction markets should also improve. The key to the magnitude of improvement in 2026 may be the auto sector, which was relatively flat in 2025 and continues to face supply chain issues and weakening electric vehicle demand.”
The Cutting Tool Market Report is jointly compiled by AMT and USCTI, two trade associations representing the development, production and distribution of cutting tool technology and products. It provides a monthly statement on U.S. manufacturers’ consumption of the primary consumable in the manufacturing process — the cutting tool. Analysis of cutting tool consumption is a leading indicator of both upturns and downturns in U.S. manufacturing activity, as it is a true measure of actual production levels.
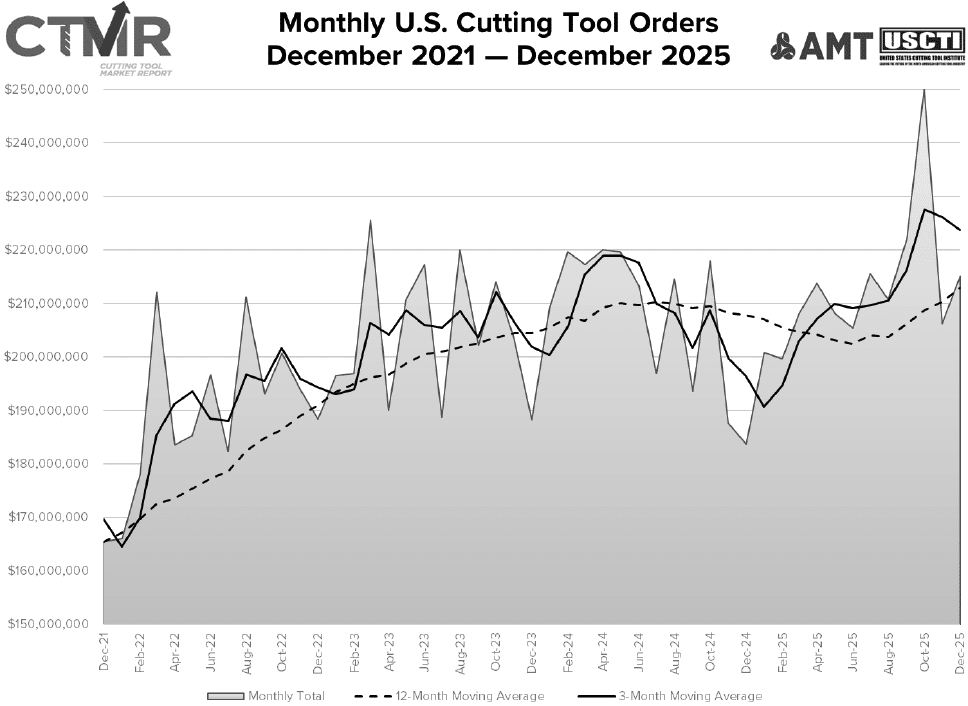
The graph below includes the 12-month moving average for the durable goods shipments and cutting tool orders. These values are calculated by taking the average of the most recent 12 months and plotting them over time. Click on the chart for a larger version.