
EDITOR’S NOTE: This forecast has been updated upon the U.S. Census Bureau’s November Wholesale Trade Report that was released on Nov. 21.
The latest monthly MDM Forecast reflected a downward revision for U.S. wholesale distribution revenues in 2025 and 2026 — largely driven by sizeable weakness in the industry’s two largest product sectors.
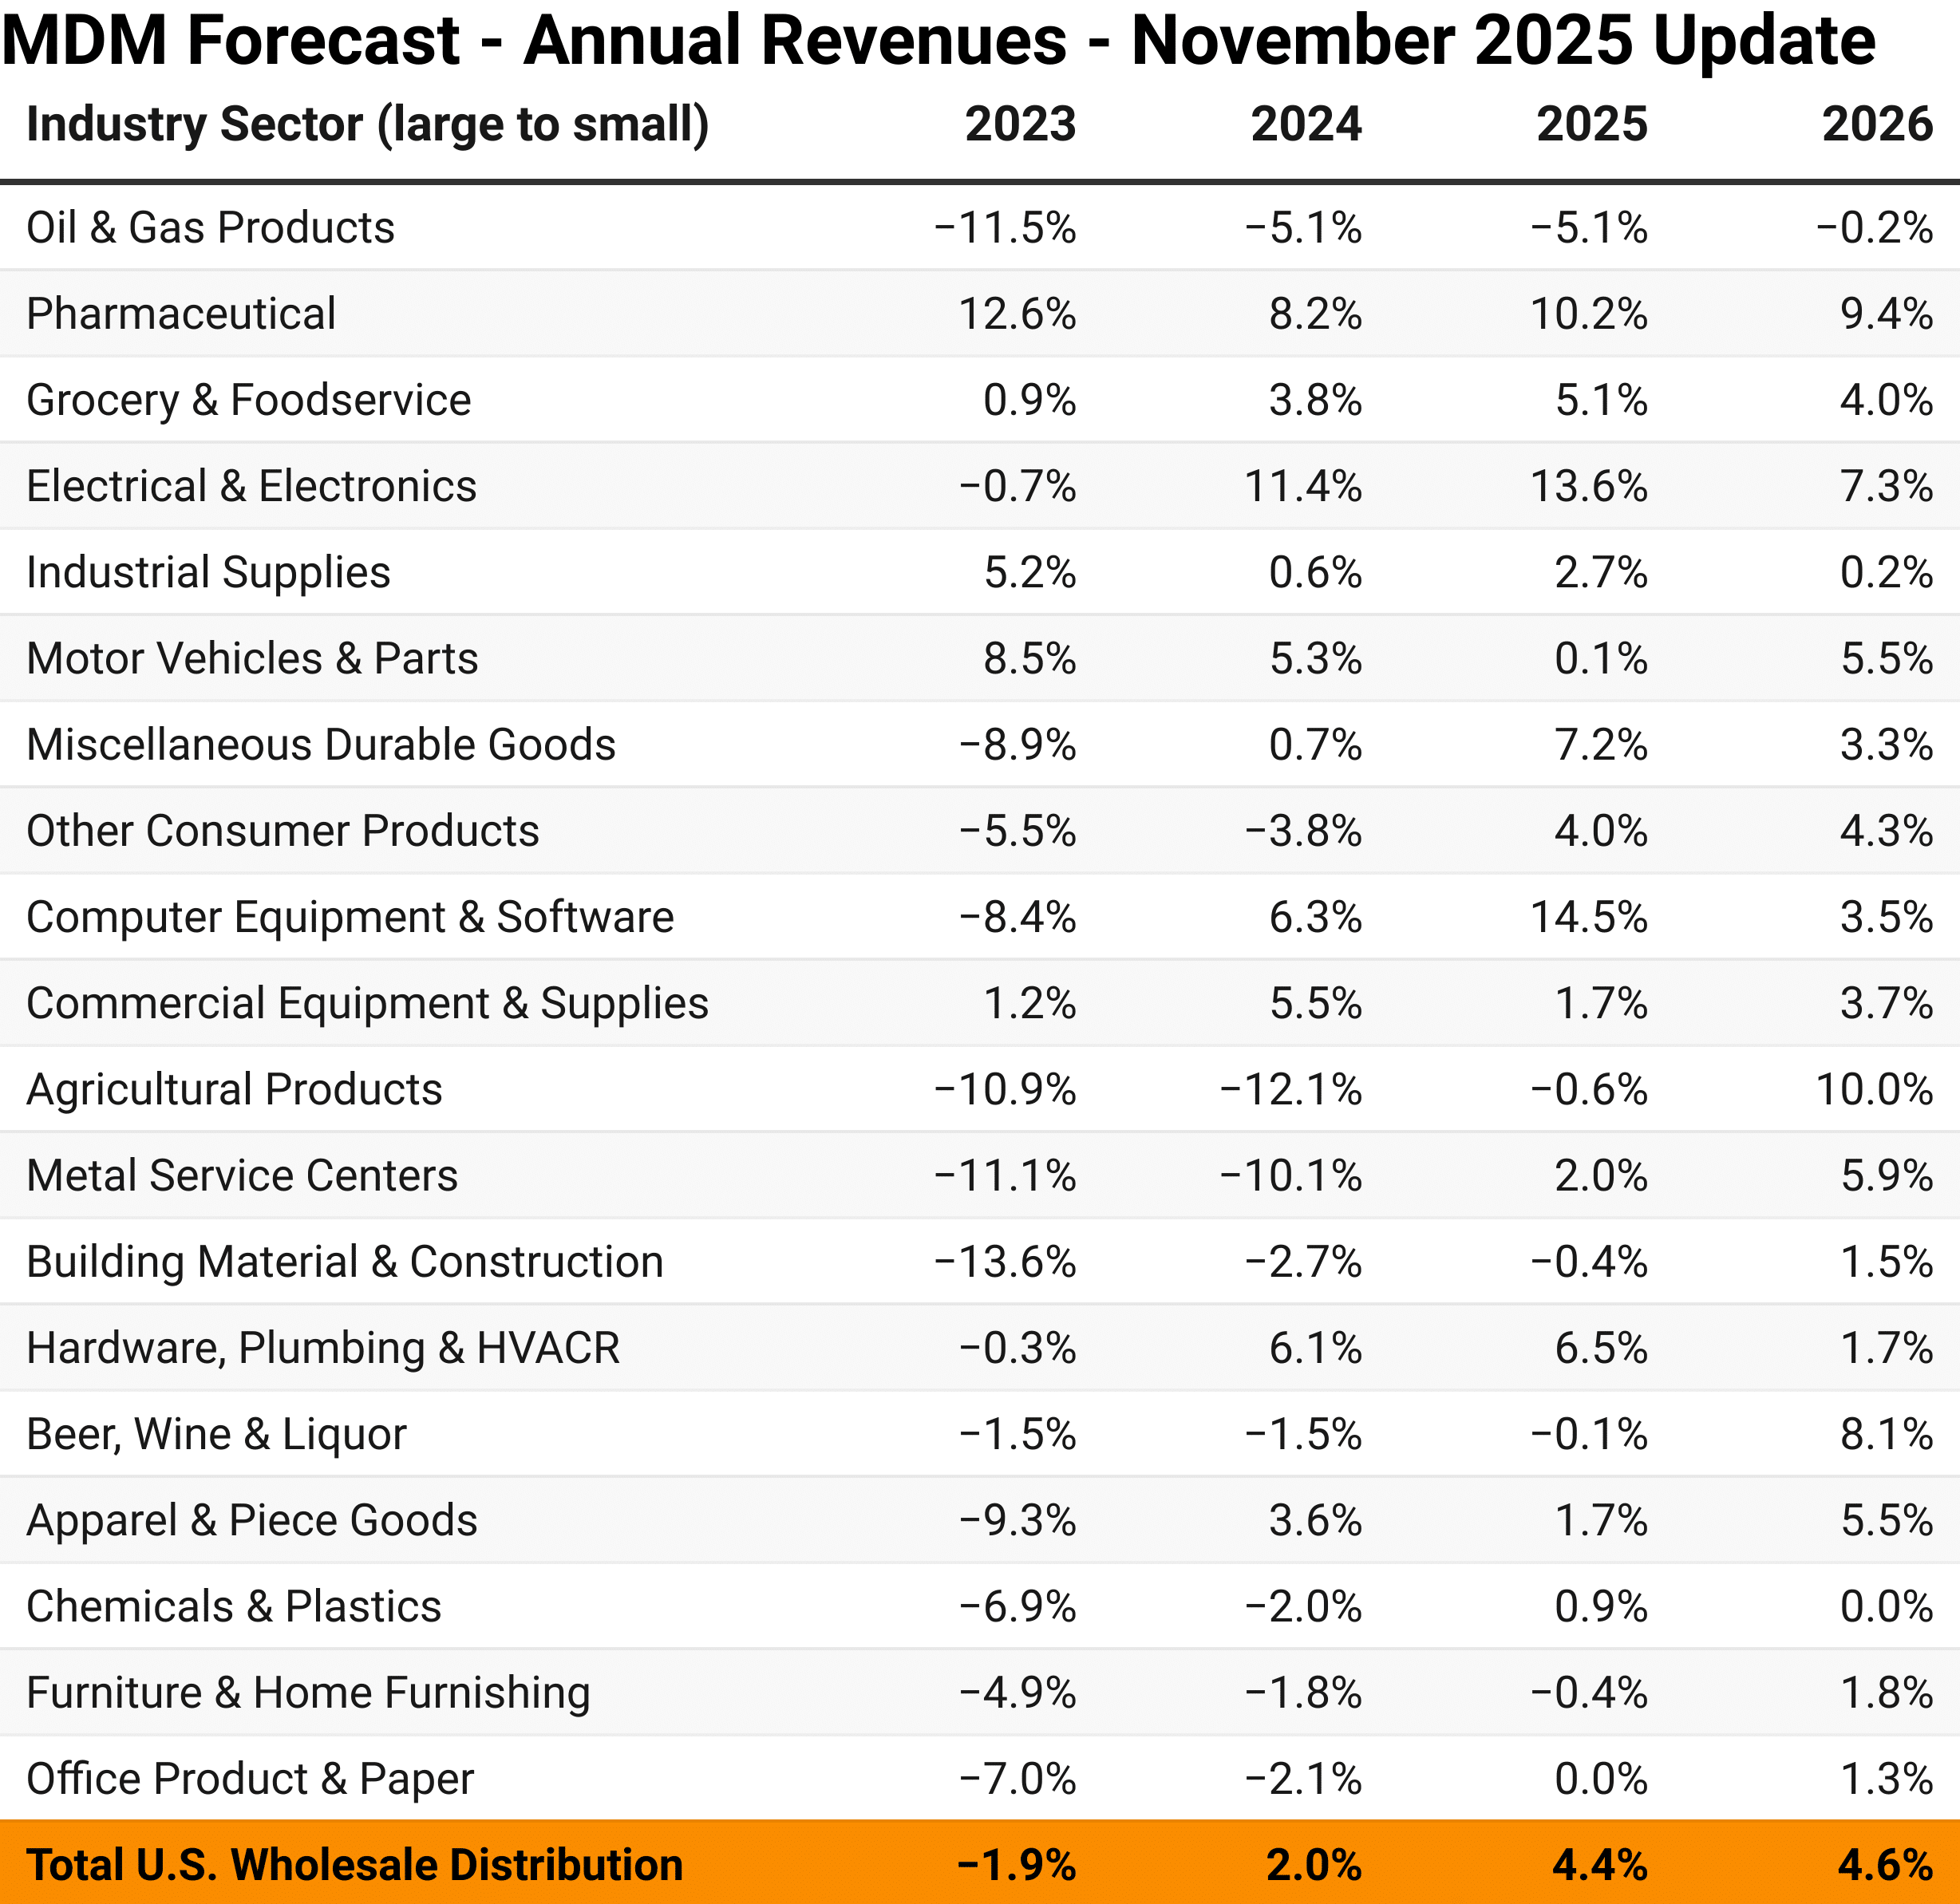
Nonetheless, we expect 2025 annual growth for 14 of the industry’s 19 sectors that the Bureau identifies, followed by growth in all but one sector in 2026.
As always, the key value in the MDM Forecast is the sector-specific forecasts it provides.
MDM’s 3Q25 MarketPulse Report (Premium access)
The MDM Forecast model uses the U.S. Census Bureau’s revenue data but strips out the broader inclusions of agents and brokers, manufacturers’ sales branches and offices, importers and exporters — focusing exclusively on wholesale distributors. The MDM Forecast utilizes the baseline economic forecast modeling from analysis firm Moody’s Analytics and applies wholesale distribution government data to it. The bureau data always trails the current month by two months, so our November forecast reflects industry activity through August 2025.
Government Shutdown Impact Note: The Bureau normally publishes its Wholesale Trade Report around the 6th-11th of each month, but due to the 43-day U.S. government shutdown, the November report wasn’t released until Nov. 21.
Data for the MDM Forecast is compiled by the Business Research Division at the Leeds School of Business of the University of Colorado Boulder.
MDM’s Free Virtual M&A Summit Coming Dec. 3. Register here!
The Big Picture
Our overall November outlook for 2025 U.S. wholesale distribution fell by 110 basis points to 4.4%. Even so, that 4.4% outlook is still above the industry’s long-run average of low-single digits. For context, the industry saw 2.0% growth in 2024 and a 1.9% decline in 2023.
The industry’s two largest sectors both had considerable downsteps in our November update that pulled down the overall figures.
Further out, our updated 2026 growth projection likewise had a 100-point decline to 4.6%. Again, still historically healthy, but a large movement for November. Oil & Gas and Pharmaceutical were again the biggest drivers, but they weren’t alone, as all but two sectors had a month-to-month decline.
In the Store: MDM’s U.S. MRO Market Trends Report
Key Context
The overall industry revenue forecast should always be taken with a grain of salt since the broad numbers are heavily influenced by those two largest sectors — Oil & Gas and Pharmaceuticals — which combined represent north of one-fourth of the industry’s total revenue.
The much bigger value of this forecast is the industry-specific outlooks as a more granular gauge for your markets.
November U.S. Wholesale Trade Revenue Forecast
November 2025 MDM Forecast: U.S. Wholesale Distribution Revenue Expectations by Sector
Click on the chart for a hi-res version
November’s 2025 Month-to-Month Differences
Our November forecast for 2025 revenues were considerably impacted by a -210 decline in Oil & Gas and a 70-point slide for Pharmaceuticals, with Electrical & Electronics (fourth largest sector) also showing a 150-point decline. Elsewhere, Metal Service Centers was the biggest monthly mover at -350 points, followed by Apparel & Piece Goods at -280. Overall, 17 of the 19 sectors showed a month-to-month decline in outlook.
November’s 2026 Month-to-Month Differences
Further out, Oil & Gas (-200 bps) and Pharmaceutical (-90) likewise dragged down the industry’s overall figure, but 15 other sectors also moved more pessimistically. Like with 2025, Metals Service Centers was the biggest monthly mover at (-430).
Revenue Scenarios
Here is our latest projection for alternative revenue scenarios in U.S. wholesale distribution, reflecting scenarios for baseline, optimistic, pessimistic, baseline high and baseline low.


