New orders for American-made goods slid by 0.7% during December, according to figures published Feb. 24 by the U.S. Census Bureau.
Totalling $617.5 billion, December’s figure followed a 2.7% November increase and mostly in line with market expectations of a 0.5% decrease. December shipments increased 0.5% after a 0.2% November dip, while unfilled orders increased 0.9% after a 1.4% November increase. The unfilled orders-to-shipments ratio was 7.01, down from 7.01 in November.
Inventories, meanwhile, ticked up 0.1% in December for a third straight increase and the inventories-to-shipments ratio was 1.56, down from 1.57 in November.
December U.S. manufactured goods orders: Month-over-Month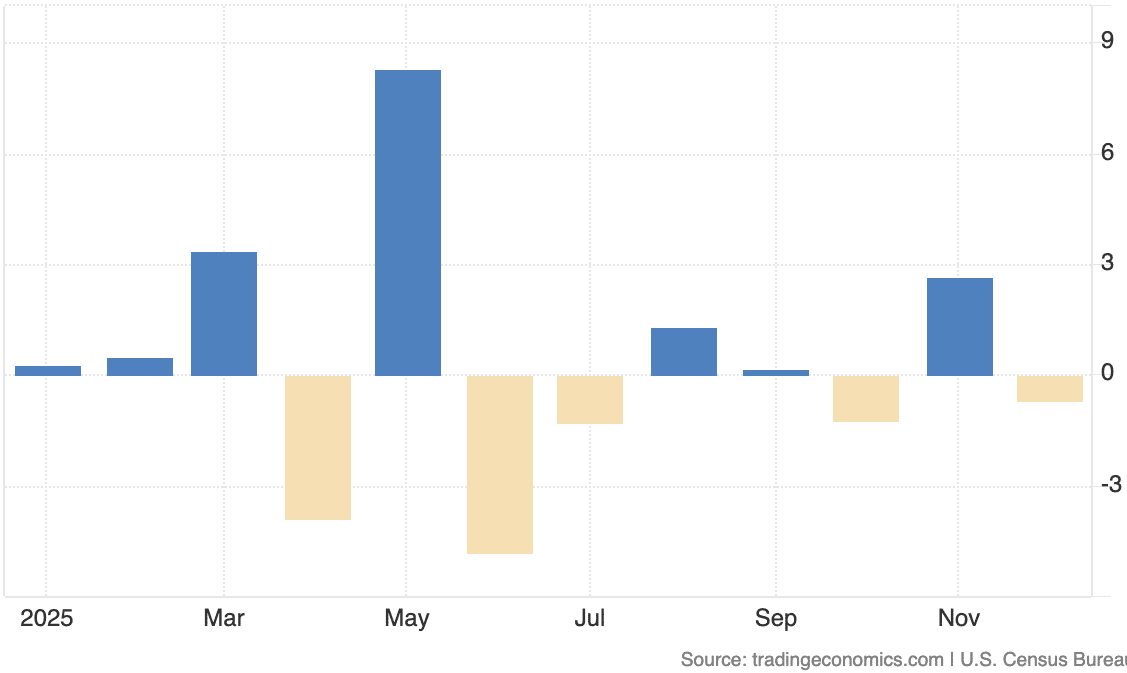
The biggest driver of December’s decline was — as almost always — volatile aircraft orders, as nondefense aircraft and parts orders sunk 24.8% to push broader transportation equipment down 5.4%. Zooming out further, durable goods orders fell 1.4% after a 5.4% November jump. Nondurable goods orders were virtually unchanged in December vs. November.
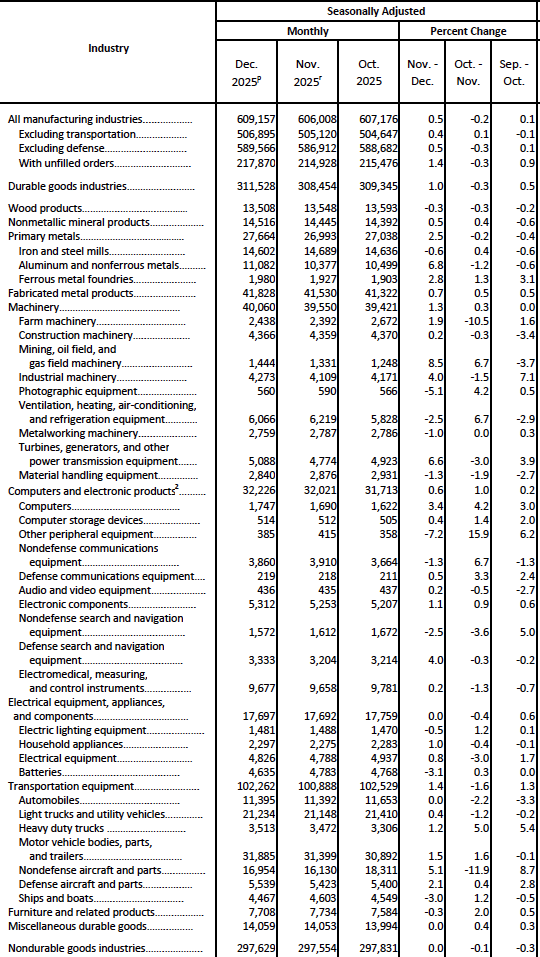
December shipments of durable goods increased 1.0% in December to $311.5 billion after a 0.3% November decrease, led by transportation’s 1.4% to $102.3 billion. Nondurable goods shipments were virtually unchanged at $297.6 billion after a 0.1% November dip.
Orders for nondefense capital goods excluding aircraft — known as core capital goods — increased 0.8% in December, revised up from a preliminary 0.6% reading and matching November.
By product category, notable higher orders were recorded for computers and electronics (+3.1%), machinery (+0.5%), fabricated metal products (+0.9%) and primary metals (+2.1%), while electrical equipment, appliances and components were relatively flat (+0.3%).
On a year-to-date basis, total factory orders finished 2025 up 3.7% annually, with durable goods up 7.8%. Excluding transportation, durable goods orders were up 0.9%, and excluding defense, orders were up 3.3%. Annual nondurable goods orders finished 2025 down 0.3%. Core capital goods orders were up 2.5% annually.
U.S. manufactured durable goods orders: Month-over-Month
The chart below shows the Bureau’s December data for seasonally adjusted manufactured goods orders data of monthly order values and their percent change vs. the previous two months. Click on the chart for a hi-res view.