
U.S. wholesale inventories increased again in April, though at a slower-than-expected pace after a sharp buildup over the previous two months.
The U.S. Census Bureau’s May 29 Advance Economic Indicators Report showed that merchant wholesale inventories — adjusted for seasonal variations and trading day differences, but not for price changes — ended April at $938.6 billion. That was up 0.5% from March and 3.4% from April 2025.
April’s gain followed a revised 1.5% month-to-month jump in March, which the Census revised upward from its preliminary estimate of 1.3%. That came after inventories increased 0.9% in February and declined 0.3% in January.
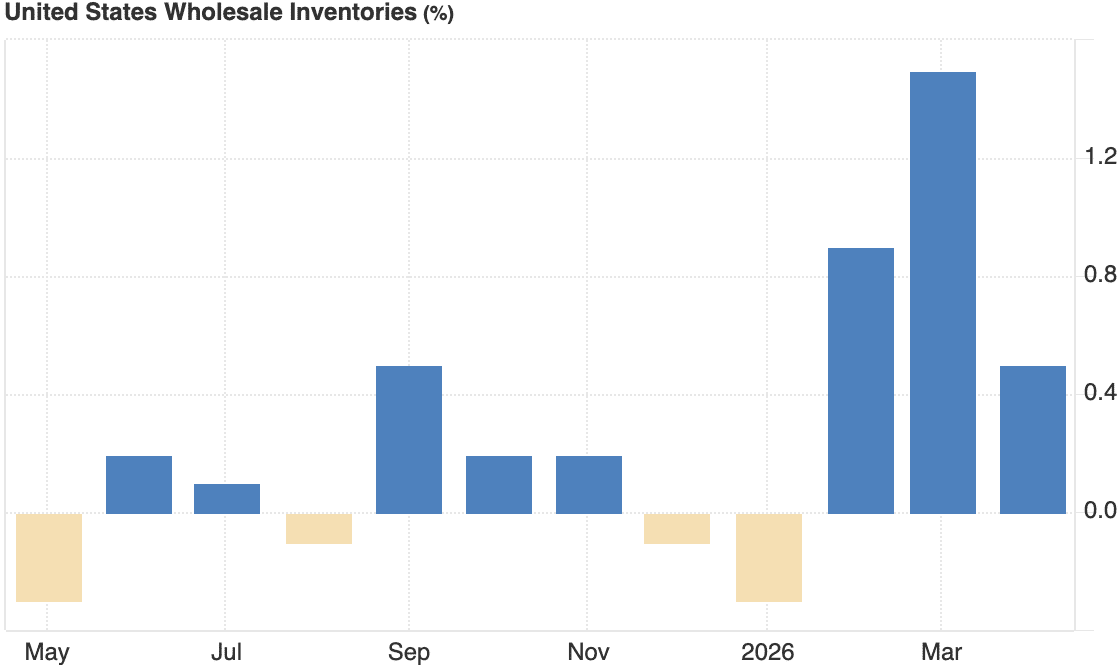
The latest figure suggests inventories remained elevated entering the second quarter, but that the pace of accumulation moderated after the February-March surge. April’s 0.5% increase was also below market forecasts of 0.8%, signaling that stockloading may be starting to cool after wholesalers built inventories aggressively earlier in the year.
Recent gains have likely reflected some frontloading as companies worked to secure stock amid disruptions tied to the Iran War and Strait of Hormuz conflict. That dynamic appears to have been most pronounced in March, when wholesale inventories posted their strongest monthly gain of the recent stretch, before easing in April to a still-solid advance.
The April report showed a split between durable and nondurable goods. Durable goods inventories rose 0.9% month-to-month to $584.6 billion and were up 2.3% year-over-year. Nondurable goods inventories declined 0.2% from March to $354.0 billion, though they remained 5.2% above April 2025 levels.
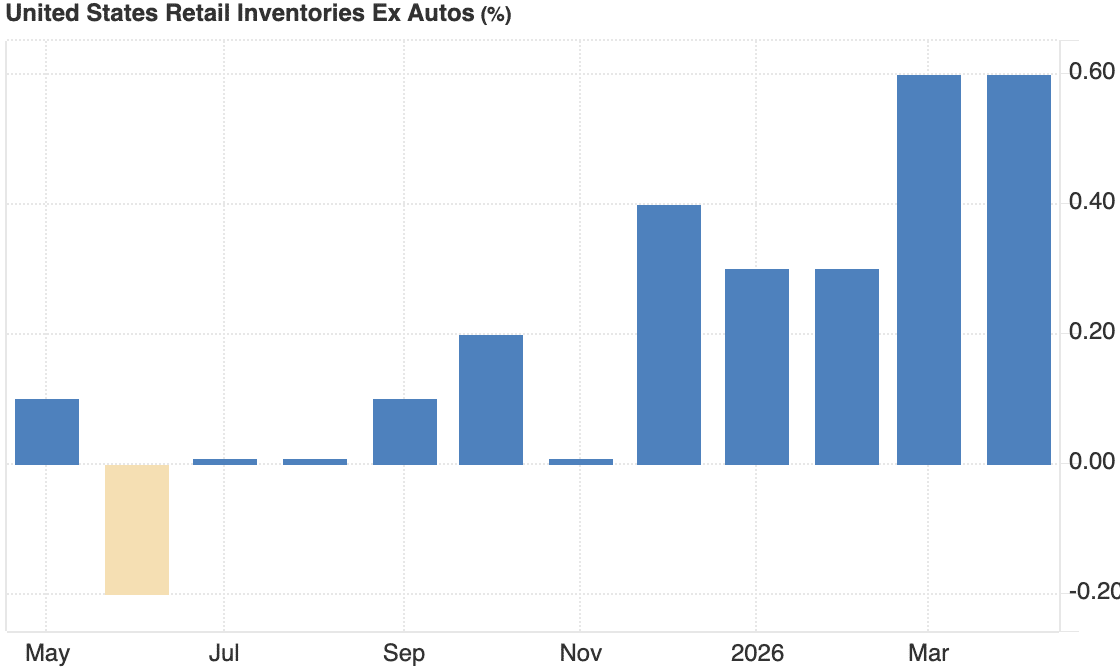
Retail inventories also climbed in April, rising 0.7% from March to $827.3 billion. That was up 3.0% from April 2025. Retail inventories excluding motor vehicles and parts increased 0.6% month-to-month, while motor vehicle and parts dealers’ inventories rose 0.9%.
The Census Bureau’s full June wholesale trade report — reflecting data through April — is scheduled for a June 9 release.
See the complete Census monthly figures below for U.S. International Trade in Goods (Seasonally-Adjusted) by product category, and for U.S. Inventories by broader industry group
Table A. U.S. International Trade in Goods — Seasonally Adjusted
| Category | April 2026 | March 2026 | February 2026 | % Change Apr/Mar | % Change Mar/Feb | % Change Apr 2026/Apr 2025 |
|---|---|---|---|---|---|---|
| Balance | -82,400 | -85,269 | -81,737 | — | — | — |
| Exports | 219,670 | 211,200 | 205,262 | 4.0% | 2.9% | 15.6% |
| Foods, Feeds & Beverages | 14,969 | 15,020 | 14,004 | -0.3% | 7.3% | 9.5% |
| Industrial Supplies | 88,254 | 86,401 | 81,574 | 2.1% | 5.9% | 17.8% |
| Capital Goods | 71,258 | 66,280 | 65,136 | 7.5% | 1.8% | 20.6% |
| Automotive Vehicles, etc. | 12,832 | 13,201 | 12,927 | -2.8% | 2.1% | 5.6% |
| Consumer Goods | 22,777 | 21,133 | 23,076 | 7.8% | -8.4% | 6.8% |
| Other Goods | 9,579 | 9,166 | 8,545 | 4.5% | 7.3% | 8.2% |
| Imports | 302,070 | 296,469 | 286,999 | 1.9% | 3.3% | 9.6% |
| Foods, Feeds & Beverages | 17,455 | 17,405 | 16,822 | 0.3% | 3.5% | -5.5% |
| Industrial Supplies | 53,082 | 54,129 | 51,813 | -1.9% | 4.5% | 2.2% |
| Capital Goods | 126,673 | 119,971 | 118,237 | 5.6% | 1.5% | 40.1% |
| Automotive Vehicles, etc. | 34,673 | 35,214 | 32,172 | -1.5% | 9.5% | 4.6% |
| Consumer Goods | 55,976 | 56,526 | 54,040 | -1.0% | 4.6% | -19.8% |
| Other Goods | 14,211 | 13,225 | 13,914 | 7.5% | -5.0% | 19.6% |
Table B. U.S. Inventories — Adjusted
| Category | April 2026 | March 2026 | April 2025 | % Change Apr/Mar | % Change Mar/Feb | % Change Apr 2026/Apr 2025 |
|---|---|---|---|---|---|---|
| Merchant wholesale trade, total | 938,640 | 934,259 | 907,841 | 0.5% | 1.5% | 3.4% |
| Durable goods | 584,610 | 579,653 | 571,279 | 0.9% | 0.5% | 2.3% |
| Nondurable goods | 354,030 | 354,606 | 336,562 | -0.2% | 3.2% | 5.2% |
| Retail trade, total | 827,304 | 821,385 | 803,269 | 0.7% | 0.7% | 3.0% |
| Total excl. motor vehicles & parts | 562,474 | 558,869 | 550,704 | 0.6% | 0.6% | 2.1% |
| Motor vehicle & parts dealers | 264,830 | 262,516 | 252,565 | 0.9% | 1.1% | 4.9% |
Related Posts
-

Though up year-over-year, September wholesale durable goods sales saw a considerable monthly decline. We break…
-

We break down the latest key industry figures, including a new look at year-to-date vs.…
-

Core inflation likewise jumped, while a major increase in the index for final demand services…