Fastenal reported its 2024 first quarter financial results on April 11, which showed that adverse weather and poor demand drove relatively weaker sales and profit, and a ‘tricky’ fiscal calendar didn’t help its overall March results.
The Winona, MN-based distributor of industrial and construction supplies posted 1Q total sales of $1.90 billion, up 1.9% year-over-year and up 7.7% sequentially from 4Q23. Daily sales were also up 1.9%.
The company’s 1Q gross profit of $862 million increased 1.4% year-over-year, with gross margin of 45.5% down 20 basis points. Operating profit of $390 million ticked down 0.8% year-over-year as operating margin of 20.6% fell 60 bps, while net profit of $298 million improved 0.9%.
Fastenal stated that adverse weather effects reduced 1Q sales by 35-55 bps, compared to a 20-40 bps impact in 1Q23. In its investor presentation, the company noted that “the core issue remains poor demand.”
Commenting on Fastenal’s 1Q report, Baird’s Industrial Distribution Equity Research division stated in a note: “Overall, while results were slightly soft and the stock likely trades lower today given performance leading up to the quarter, we view the report as consistent with a broadly soft near-term industrial environment.”
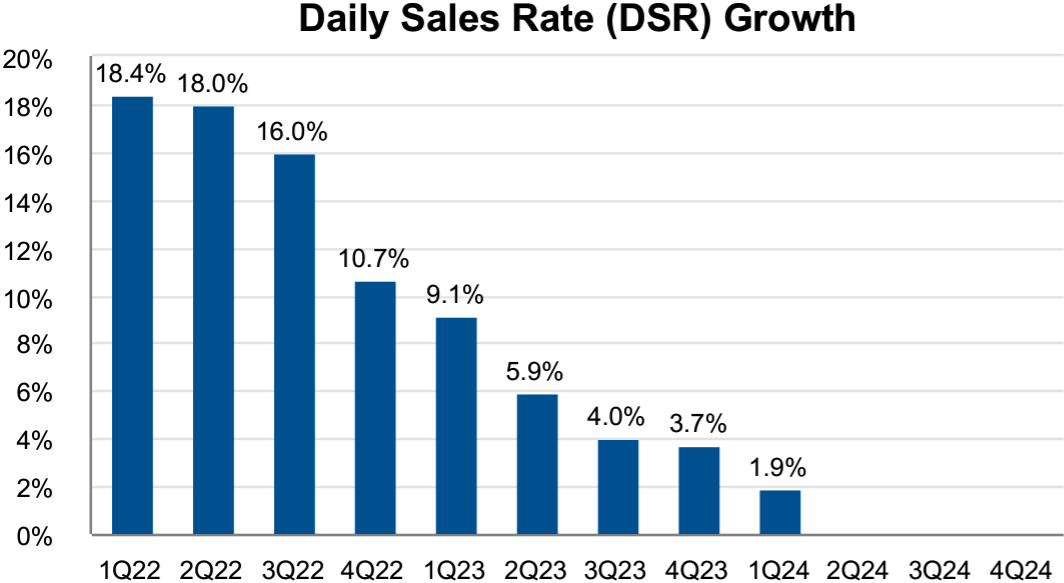
Here’s how Fastenal’s year-over-year daily sales rate has performed each quarter since the start of 2022:
MDM Podcast: A Breakdown of Fastenal’s Decade-Long “Big Pivot” (Feb. 21)
1Q Revenue Growth Drivers & Pricing Impact
Like in 4Q23, Fastenal said it experienced higher unit sales in 1Q primarily due to growth with larger customers and Onsite locations opened in the last two years. Meanwhile, product pricing’s impact was immaterial to net sales — a stark difference from a year earlier when pricing had a 290-320 bps impact on 1Q23 sales, reflecting pricing regulation since then. The company noted that incremental pricing actions over the past 12 months have been modest in scope.
1Q Product Line Performance
Here’s how Fastenal’s three product categories performed in 1Q24 on a year-over-year daily sales rate change:
- Fasteners – 31.5% of sales: -4.4% (-2.3% in 4Q23)
- OEM Fasteners – 19.6% of sales: -4.0%
- MRO Fasteners – 11.9% of sales: -5.1%
- Safety Supplies – 21.6% of sales: +8.3% (+9.4% in 4Q)
- Other – 46.9% of sales: +3.9%, (+5.3% in 4Q)
1Q Customer End Market Performance
Here’s how Fastenal’s customer end markets performed in 1Q24 on a year-over-year daily sales rate change:
- Manufacturing – 75.0% of sales: +2.6%
- Heavy manufacturing – 43.4% of sales: +2.7% (+5.8% in 4Q)
- Other manufacturing – 31.6% of sales: +2.5% (+3.3% in 4Q)
- Non-residential construction – 8.5% of sales: -6.6% (-7.4% in 4Q)
- Reseller – 5.7% of sales: -2.5% (-8.9% in 4Q)
- Other – 10.8% of sales: +7.7% (+13.% in 4Q)
4Q Customer/Channel Typer Performance
Here’s how Fastenal’s customer end markets performed in 1Q24 on a year-over-year daily sales rate change:
- National accounts – 62.0% of sales: +6.3% (+8.5% in 4Q)
- Non-national accounts – 38.0% of sales: -4.5% (-3.2% in 4Q)
Onsites, Vending & eCommerce
Fastenal signed 102 new Onsite locations during 1Q24, up from 58 during 4Q23. It had 1,872 active sites at the end of March, up 11.8% from a year earlier. The company’s goal for 2024 Onsite signings remains between 375-400. Daily sales through Onsite locations (excluding sales transferred from branches to new onsites), grew at a low single-digit rate in 1Q, compared to a mid single-digit rate in 4Q.
Fastenal’s 1Q sales from its FMI Technology — comprised of its FASTStock, FASTBin and FASTVend offering — totaled $797 million (41.5% of total) increased 7.6% year-over-year (+11.3% in 4Q), with daily sales up by that same amount.
Fastenal signed 6,726 weighted FASTBIN and FASTVend devices in 1Q, up 14.0% year-over-year, while the 115,653 installations it had at the end of March were up 10.5%. The company said its goal for those device signings in 2024 remains between 26,000-28,000.
eCommerce & Digital Footprint
Fastenal said that daily sales through the company’s eCommerce (via web verticals, EDI or other technical integrations) grew 33.6% in 1Q year-over-year (+28.3% in 4Q) and represented 28.6% of total sales (24.8% in 4Q).
The company’s digital footprint — comprised of eCommerce plus FMI — represented 59.2% of total 1Q sales, up from 58.1% in 4Q23 and 54.1% in 1Q23.
Employee & Branch Count
Fastenal ended March with a total headcount of 23,695 — up 3.8% year-over-year and up 2.1% from 4Q23.
- Selling headcount of 16,764 was up 3.6% year-over-year and up 1.5% from 4Q
- Distribution headcount of 4,184 was up 4.5% year-over-year and up 3.5% from 4Q
- Manufacturing headcount of 753 was flat year-over-year and up 2.7% from 4Q
- Organizational support headcount of 1,994 was up 5.7% year-over-year and up 4.2% from 4Q
Fastenal closed five branches during 1Q24 and didn’t open any, bringing its total branch count to 1,592 at the end of March. That’s down 5.4% from the end of 2022, down 20.5% from the end of 2020 and down 39.6% from the end of 2014. Meanwhile, Onsite growth has pushed Fastenal’s total in-market locations count to 3,464 at the end of March, which has grown steadily every year in that same stretch.
Fastenal’s March
Fastenal’s overall March results were skewed by having two fewer business days than a year earlier, leading to overall monthly sales of $676 million that were down 7.0% year-over-year, while daily sales were up 1.8% — following February’s 2.6% and January’s 1.6%.
Daily Sales by Geography, Year-Over-Year:
- United States – 83.1% of sales: +1.0% (+4.8% in Feb.)
- Canada/Mexico – 13.6% of sales: +5.0% (+9.4% in Feb.)
- Rest of World – 3.3% of sales: +9.6% (+1.3% in Feb.)
Daily Sales by Product Line:
- Fasteners – 31.6% of sales: -3.7% (-1.9% in Feb.)
- Safety – 21.2% of sales: +6.8% (+11.2% in Feb.)
- Other – 47.2% of sales: +3.8% (+6.4% in Feb.)
Daily Sales by Customer End Market:
- Heavy manufacturing – 43.5% of sales: +2.0% (+5.7% in Feb.)
- Other manufacturing – 31.6% of sales: +3.4% (+4.6% in Feb.)
- Non-residential construction – 8.6% of sales: -7.4% (-5.5% in Feb.)
- Reseller – 5.8% of sales: +2.6% (-6.9% in Feb.)
- Other – 10.5% of sales: +5.1% (+21.0% in Feb.)
Daily Sales by Customer Category:
- National accounts: +6.0% (+11.0% in Feb.)
- 58.0% of Top 100 national accounts were growing (68.0% in Feb.)
- Non-national accounts: -4.0% (-3.0% in Feb.)
- 50.1% of in-market locations were growing (53.4% in Feb.)
- FMI: +6.0% (+11.0% in Feb.)
- eProcurement: +30.0% (+28.0% in Feb.)
Other Notes
- Fastenal is set to host its annual customer expo on April 17-18 in Nashvile, TN. The company said the event is overbooked with 50% more customer attendees registered than in 2023 (and double that of 2022).
Related Posts
-

The company saw a sharp deceleration in daily sales, hampered by weather impacts during the…
-

Net sales for the first quarter of the company's fiscal year were $1.1 billion, an…
-

On a constant currency basis, sales decreased 7.8% year-over-year and decreased 2.9% sequentially, Avnet said…