Running a distribution center or warehouse while embracing a philosophy of continuous improvement will result in cost savings, improved customer service, reduced waste and more efficient operations.
Cost savings come from lower labor costs, fewer errors, faster fulfillment and improved order accuracy. Faster delivery times, better inventory management and enhanced customer experience bring improved customer service. Better utilization of resources and materials reduces waste. Finally, increased efficiency allows for better scalability to manage larger volumes of orders and improved response times to changes in market trends.
All great stuff, but how do you make it so? Spaghetti.
The layout of your distribution center or warehouse helps to determine the efficiency of the flow of goods in and out, and ultimately plays a role in the overall effectiveness and efficiency of the operation. When a facility first opens, it is typically laid out in the most efficient manner. However, the initial efficiency can be lost as the operation grows and changes. A spaghetti diagram is a visual tool used to analyze the flow of goods in and out of a distribution center, and it provides an effective way to identify inefficiencies and develop improvement strategies. The diagram consists of a series of lines representing the movement of goods from one point to another. By analyzing the lines, you can identify areas of congestion, delays and other problems that can be addressed to improve the flow of goods.
Here’s an example:
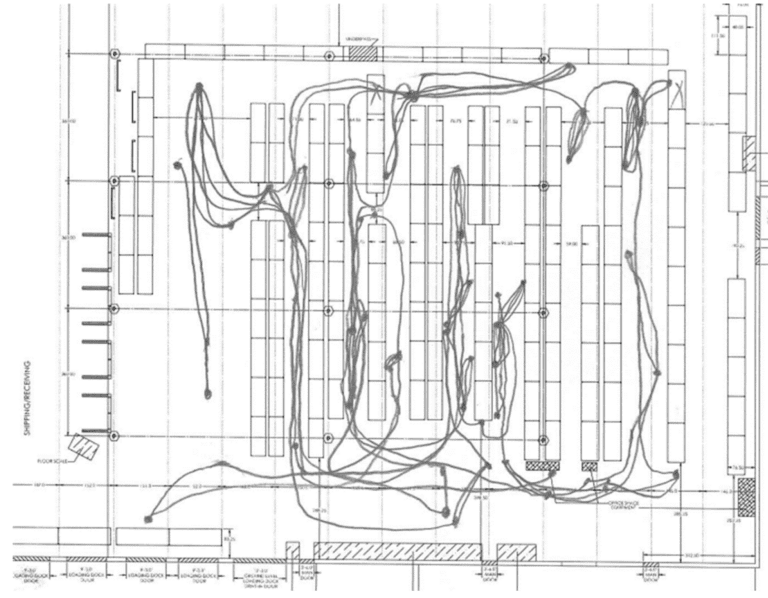
The first step in creating a spaghetti diagram is to map the flow of goods in and out of your distribution center. This can be done by drawing facility diagrams and labeling each area where goods enter or exit. Include all entry and exit points, all loading docks, all conveyor belts and all other places where goods are moved. Then the diagram should be labeled with the types of goods entering or exiting each area. This does not have to be a fancy AutoCAD-generated image. You can draw it by hand or use Excel to map your layout.
The next step is to draw lines on the diagram to represent the flow of goods. Using different colors to represent different types of travel by people, forklifts and electric pallet jacks can be helpful. Areas of congestion and safety concerns can be highlighted. The lines should start at the point of entry and end at the point of exit. Stations will include:
- Receiving
- Staging
- Quality control
- Put away
- Picking
- Packing
An overall spaghetti diagram should be created to maximize the efficient movement of goods through the facility. Additionally, individual department spaghetti diagrams can show the flow of goods through each department to reduce travel and movement where possible.
Once the diagram(s) are complete:
- Identify the main travel paths: The spaghetti diagram will show workers and equipment paths through the distribution center. Identify the main paths of travel and look for areas where there is a lot of backtracking or unnecessary travel.
- Identify areas of congestion: The diagram will also show you areas with a lot of congestion. This could be due to narrow aisles, poor layouts or bottlenecks in the process.
- Identify areas of safety concern: Use the spaghetti diagram to look for areas where there is a lot of traffic or where there are sharp turns or uneven surfaces.
- Identify opportunities for improvement: Once you have identified the main problems, you can start brainstorming ideas for improvement. Share your findings with other leaders and those working in those spaces. Being transparent and including the team will generate additional insights and will accelerate buy-in for any changes that need to be made based on the results. Some possible improvements include:
- Reorganizing the layout of the distribution center.
- Redesigning the picking and packing processes.
- Investing in new equipment like automation or robotics.
- Providing training to workers.
- Implement the improvements: Once you have identified the best course of action, you implement the improvements.
- Monitor the results: Once the improvements are in place, you need to monitor the results to see if they have been effective. You can do this by tracking the amount of time it takes to pick and pack orders or by monitoring the number of accidents that occur. Once the remaining areas of inefficiency have been identified, strategies can be developed to improve the flow of goods further. This may include reorganizing the facility’s layout, adding additional equipment, or changing how goods are moved. Adjusting staffing levels or shifting schedules may also be beneficial.

Once the warehouse is set up most efficiently, a warehouse management system (WMS) can help the operation perform even more effectively by introducing best practices like task interleaving. Task interleaving is a critical WMS feature that can help increase productivity. No warehouse supervisor or manager likes to see a forklift traveling with empty forks. Task interleaving allows the system to allocate tasks to your workers to maximize their opportunity to be efficient and accomplish the maximum amount of work in the shortest time. The system may direct pickers from one warehouse spot to their next pick location to bring a pallet to the shipping dock close to their next pick location. Traditionally, this would not occur as the picker would not know the pallet needed to be moved — nor would the picker get any efficiency credit for doing so. The process allows different functions to accomplish tasks that increase the overall efficiency of the entire operation.
Other efficiency features in a WMS include but are not limited to appointment scheduling, inventory management, wave planning & allocation, 3D visual warehouse, receiving and directed put away, task management, picking and packing flexibility, cross-docking, yard visibility, replenishment, kitting and value-added services (VAS), load management and extensive reporting.
Spaghetti diagrams are part of the six sigma methodology. Many online resources can help you if you are unfamiliar with six sigma methodologies. Please reach out to learn how Infor can help your organization at [email protected].
Related Posts
-

The new facility adds nearly 20,000 square feet of warehouse and office space to IEWC’s…
-

A new 230,000-square-foot warehouse and distribution center is expected to increase capacity in the largest…
-

The new Northwest Distribution Center is expected to house more than 135,000 industrial supply items,…