
After slowing to a meager 0.5% growth in 4Q25, the U.S. economy accelerated in 1Q26, though well below its 10-year average and behind market expectations.
The Commerce Department shared its preliminary real GDP report on April 30, which was led by the top line figure of 2.0% annual growth growth (seaonally- and inflation-adjusted).
Economists had expected 2.2-2.3% 1Q26 GDP growth.
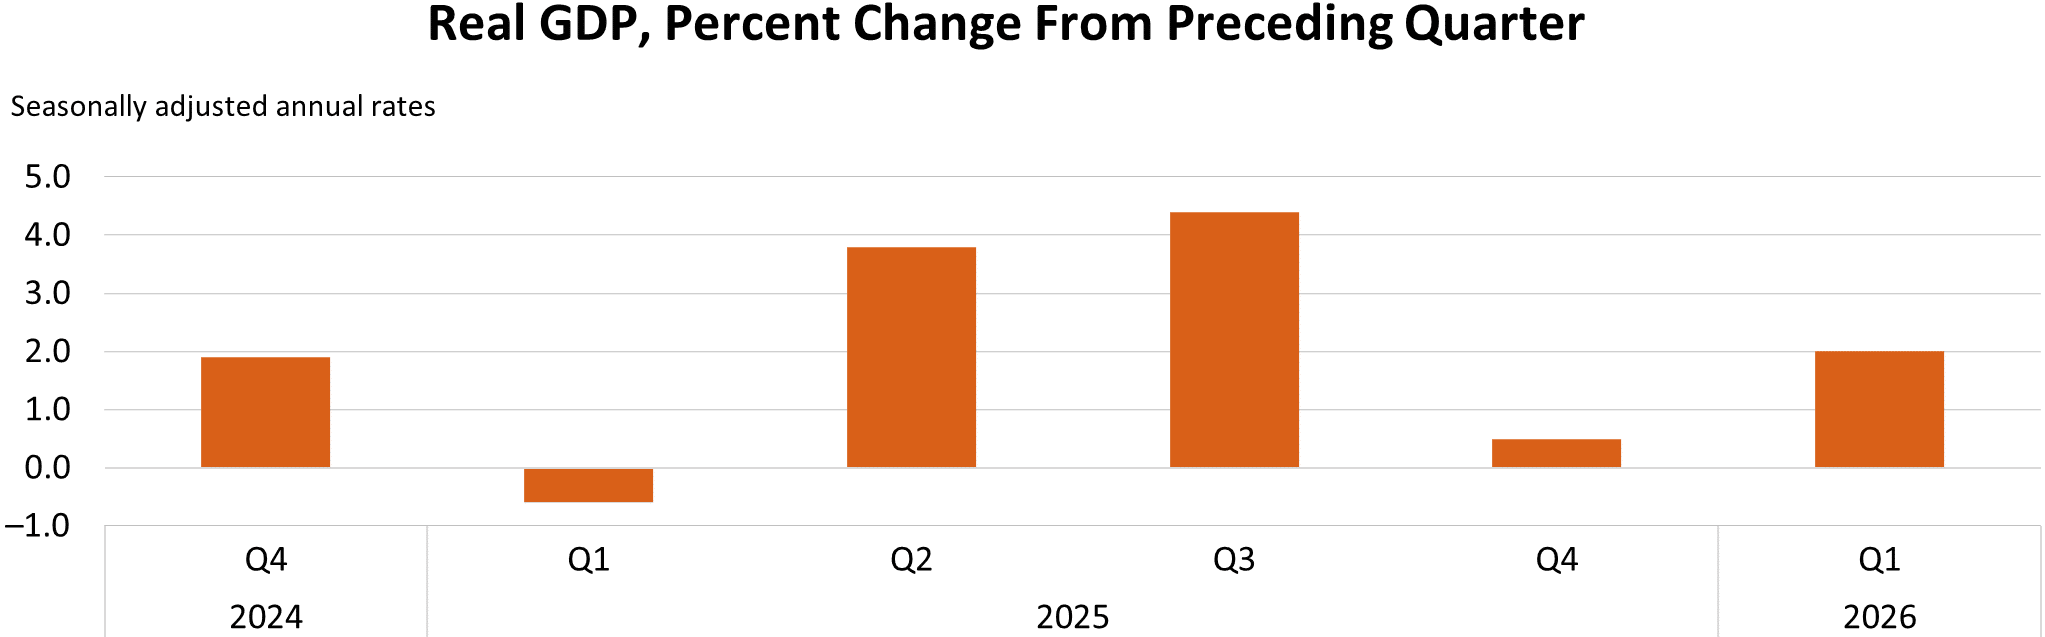
The Bureau of Economic Analysis detailed that 1Q’s sequential improvement reflected upturns in government spending and exports and an acceleration in investments that were partly offset by a deceleration in consumer spending, while imports turned up.
The increase in investment reflected increases in equipment, intellectual property (IP) products and private inventory investment that were partly offset by decreases in residential and nonresidential structures.
- Within equipment, the increase was driven by information processing equipment (notably, computers and peripheral equipment) tied to data center demand
- The increase in IP products primarily reflected an increase in software
- Within private inventory investment, the increase was driven by increases in retail and wholesale trade
- The decrease in residential structures was driven by new single-family units and brokers’ commissions. The decrease in nonres structures was driven by manufacturing structures
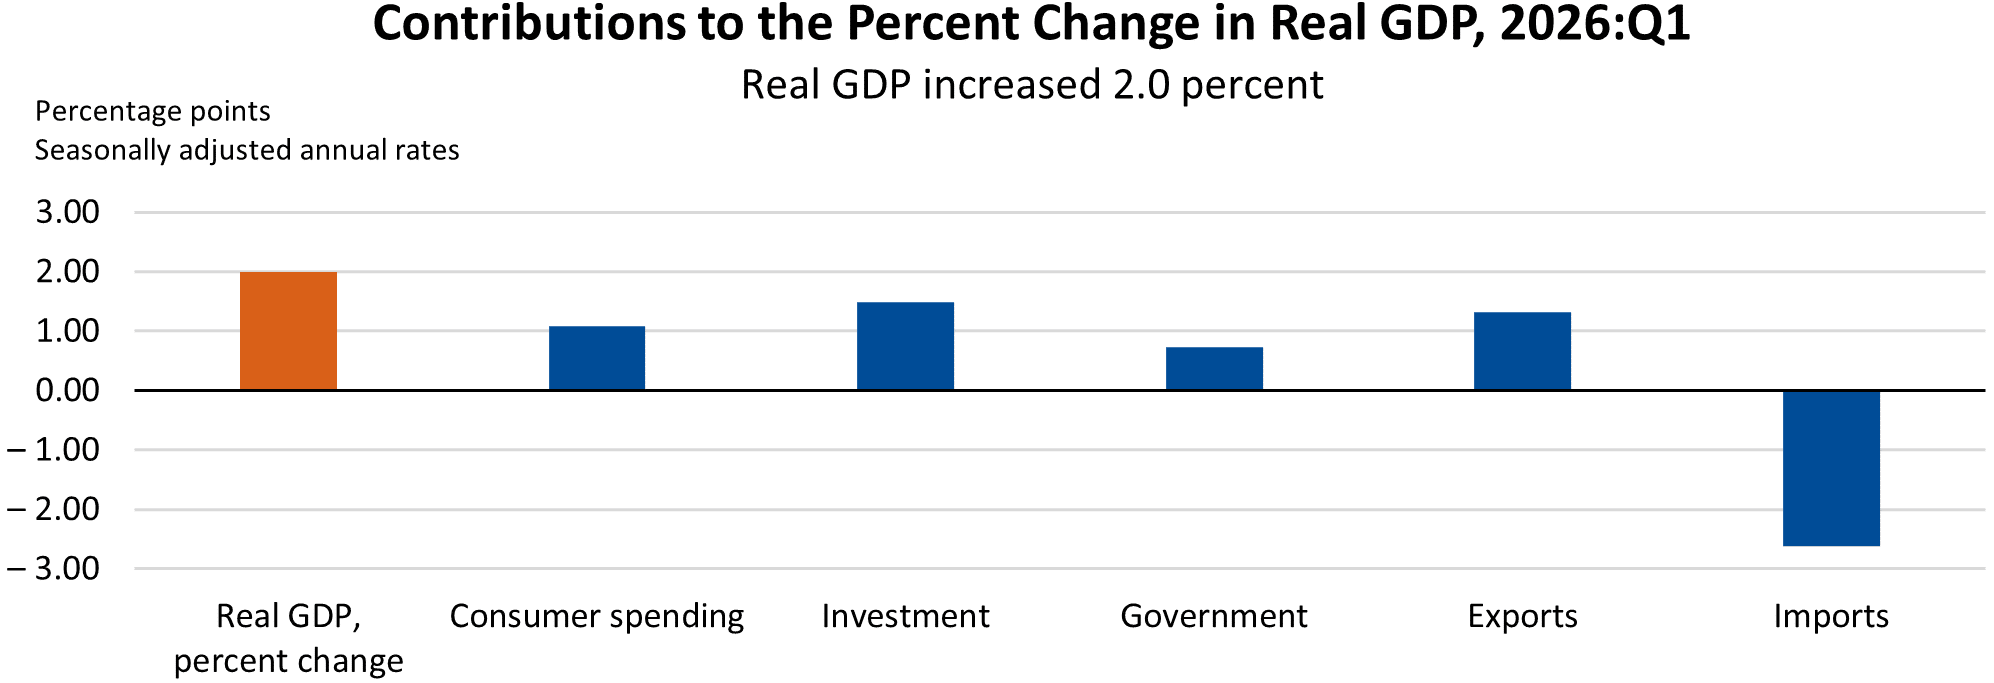
Real final sales to private domestic purchasers — the sum of consumer spending and gross private fixed investment — increased 2.5% quarter-to-quarter after a 1.8% 4Q increase.
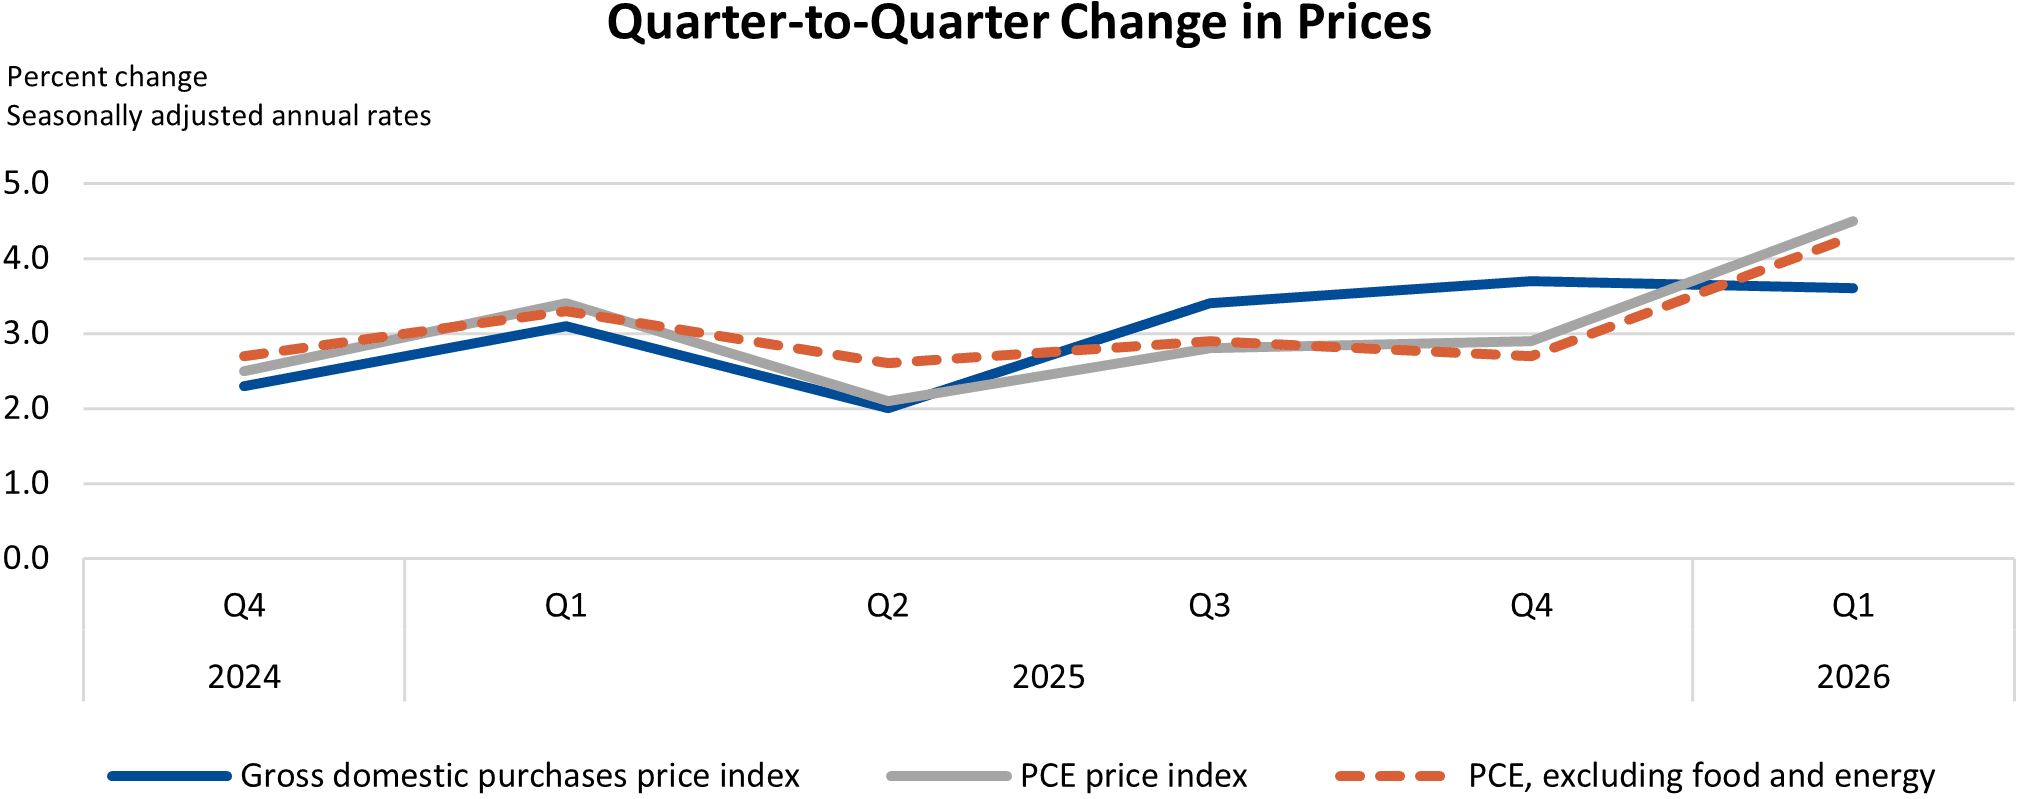
The price index for gross domestic purchases increased 3.6% in 1Q, narrowly behind 4Q’s 3.7%. The personal consumption expenditures (PCE) price index increased 4.5%, well ahead of 4Q’s 2.9%, and the PCE price index excluding food and energy increased 4.3% vs. 4Q’s 2.7%.
MDM’s Analysis
As always when it comes to U.S. GDP, MDM readers should look past the topline figure to the underlying mix. The economy still showed signs of resilient business demand, with gains in investment, exports, consumer spending and government outlays. A useful read-through for distributors: real final sales to private domestic purchasers — a cleaner measure of domestic private-sector demand — rose 2.5%, suggesting customer activity remained positive entering the year.
The caution flags were inflation and softer consumer momentum. Consumer spending cooled from the prior quarter, while PCE inflation accelerated to 4.5% and core PCE rose 4.3%. For distributors, the takeaway is constructive but not carefree: demand conditions remain supportive, but margin management, pricing discipline and inventory caution should stay front and center.
| 1Q 1st Estimate | 4Q 3rd Estimate | |
| Real GDP | 2.0% | 0.5% |
| Current-dollar GDP | 5.6% | 4.2% |
| Real final sales to private domestic purchases | 2.5% | 1.8% |
| Gross domestic purchases price index | 3.6% | 3.7% |
| PCE price index | 4.5% | 2.9% |
| PCE price index excluding food & energy | 4.3% | 2.7% |
Related Posts
-

A long-delayed Commerce Department report showed that strong consumer spending powered acceleration in the July-September…
-

The monthly CPI had its slowest acceleration since May, and core inflation had its smallest…
-

That’s half the growth from the initial estimate and a fraction of the 4.4% seen…