November 2024 U.S. cutting tool consumption totaled $183.1 million according to the latest Cutting Tool Market Report (CTMR) published by the U.S. Cutting Tool Institute (USCTI) and the Association for Manufacturing Technology (AMT).
That total was down 13.8% from October 2024, and down 9.7% from November 2023. Year-to-date shipments totaled $2.5 billion, representing a 0.3% decrease from the January-November 2023.
“Uncertainty due to the election and now potential changes to policy have kept new projects and orders for manufactured products on hold, resulting in stagnant cutting tool consumption,” AMT’s Cutting Tool Product Group Chairman Jack Burley said in a Jan. 22 news release. “Despite lower new orders for durable goods, the outlook remains optimistic for a return to more activity across all sectors. Aerospace was the most significant cause for the reduction in manufacturing activity, and many machine shops and tier 1 suppliers continue to wait for U.S. commercial aircraft orders to get back on track.”
“Recent cutting tool consumption data reveals complex dynamics in the manufacturing sector as 2024 ended, providing crucial insights into potential 2025 trends,” Jarvis Cutting Tools President Costikyan Jarvas added. “The final quarter of 2024 showed notable volatility, with October posting strong numbers followed by a significant decline in November. This pattern suggests ongoing adjustments in manufacturing production schedules and investment decisions. Overall consumption levels remain historically robust, with monthly figures consistently exceeding $180 million. With the PMI improving, Boeing going back to work, and the overall reshoring of manufacturing, 2025 looks to be a much stronger year.”
The CTMR is jointly compiled by AMT and USCTI, two trade associations representing the development, production and distribution of cutting tool technology and products. It provides a monthly statement on U.S. manufacturers’ consumption of what they tout as the primary consumable in the manufacturing process — the cutting tool.
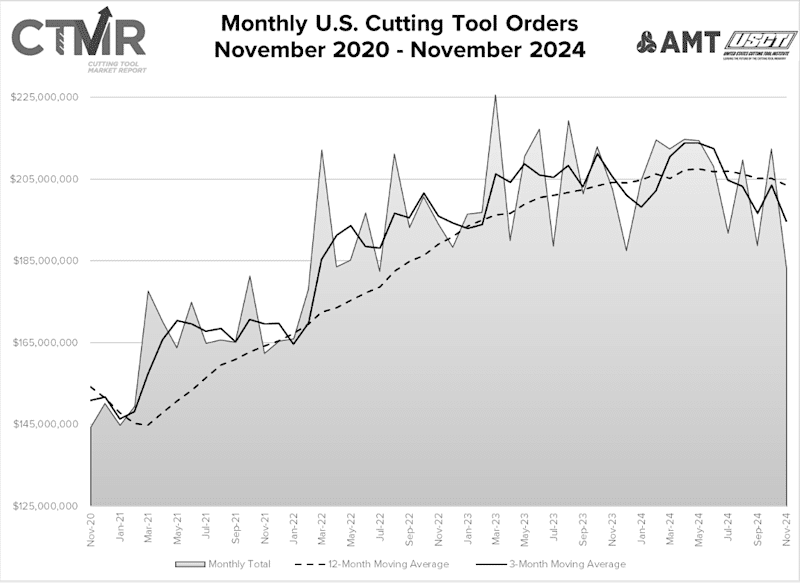
The graph below includes the 12-month moving average for the durable goods shipments and cutting tool orders. These values are calculated by taking the average of the most recent 12 months and plotting them over time. Click on the chart for a larger version.
Related Posts
-

Consumption decreased month-to-month, following a healthy gain in August.
-

However, orders rose 1.7% year-over-year.
-

The report showed a slight dip in October from the same period a year prior,…