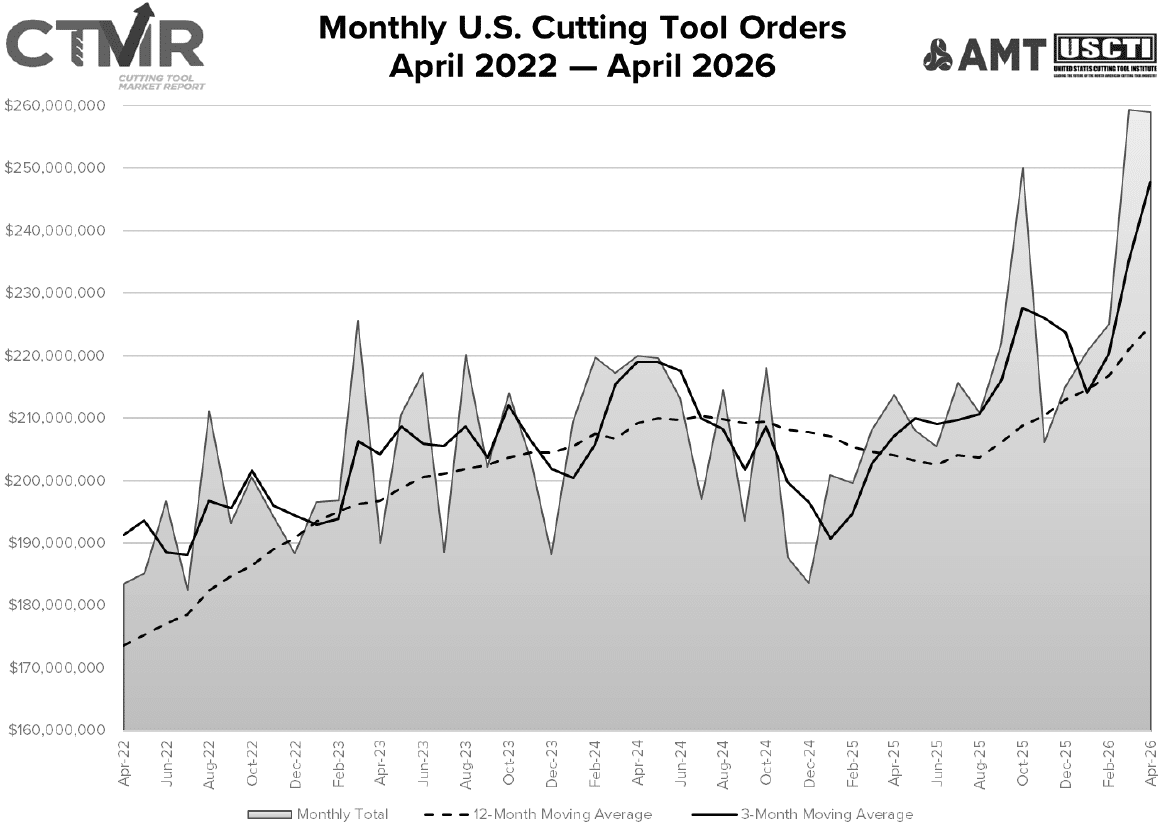
April U.S. cutting tool shipments totaled $259 million according to the latest Cutting Tool Market Report (CTMR) published June 22 by the U.S. Cutting Tool Institute and the Association for Manufacturing Technology (AMT).
That figure was virtually identical to March, which had surged 15.2% from February and 24.6% year-over-year. April’s figure dipped 0.1% vs. March and was up 21.1% year-over-year.
Year-to-date shipments totaled $964 million in April — up 17.% vs. 2026, while unit shipments decreased slightly in April after rising the previous two months.
“While shipments are up in the early months of 2026, much of the increase is due to inflation rather than increased units,” said Mike Stokely, USCTI President and EVP and Owner of cutting tool manufacturer Allied Machine & Engineering. “Raw material pricing and supply continue to be challenges for cutting tool manufacturers. These are unprecedented times, but I am cautiously optimistic.”
“Increased shipments are partially the result of robust metal cutting activity across multiple industries, but the cost of raw materials to produce cutting tools has surged over the past year or so, driving up costs and inflating shipment values,” added Alan Richter, Editor-at-Large of industry publication Cutting Tool Engineering. “In one instance, an aerospace manufacturer reported the cost of carbide tools has risen 30% to 50% over the previous three months.”
The Cutting Tool Market Report is jointly compiled by AMT and USCTI, two trade associations representing the development, production and distribution of cutting tool technology and products. It provides a monthly statement on U.S. manufacturers’ consumption of the primary consumable in the manufacturing process — the cutting tool. Analysis of cutting tool consumption is a leading indicator of both upturns and downturns in U.S. manufacturing activity, as it is a true measure of actual production levels.
The graph below includes the 12-month moving average for the durable goods shipments and cutting tool orders. These values are calculated by taking the average of the most recent 12 months and plotting them over time. Click on the chart for a larger version.