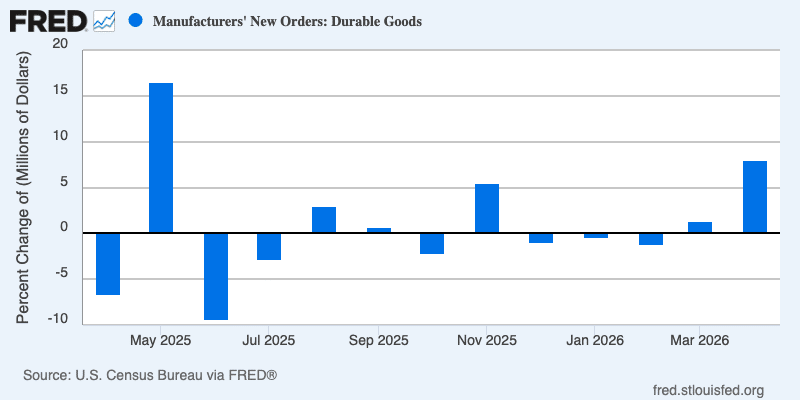
New orders for U.S. manufactured goods jumped in April, powered by a surge in transportation equipment that was led by nondefense aircraft and parts.
Overall, new orders increased $30.1 billion, or 4.8%, month-to-month to $662.7 billion, according to U.S. Census Bureau data released June 3. That followed a 1.8% March increase and marked the fifth increase in the past six months.
The April gain came despite a mixed picture outside of transportation. New orders excluding transportation increased 1.3% month-to-month, while core nondefense capital goods orders excluding aircraft decreased 1.0% to $82.5 billion after a 3.8% March gain.
Here are the key figures from the Census Bureau’s April report:
- Overall new orders increased 4.8% to $662.7 billion after a 1.8% March gain. Year-to-date, orders were up 6.0% vs. the same period in 2025.
- Shipments increased 1.0% to $641.0 billion after a 1.5% March increase.
- Unfilled orders increased 1.7% to $1.57 trillion after a 0.2% March increase. The unfilled orders-to-shipments ratio was 6.95, up from 6.88 in March.
- Inventories increased 0.3% to $959.1 billion after a 0.7% March increase. The inventories-to-shipments ratio was 1.50, down from 1.51 in March.
Durable goods
New orders for manufactured durable goods increased 8.0% in April to $346.2 billion after a 1.3% March gain.
Transportation equipment drove the increase, up $23.3 billion, or 21.6%, to $131.1 billion. Within transportation, nondefense aircraft and parts orders surged 165.9% month-to-month to $36.8 billion after a 23.0% March decrease.
Among other major durable goods categories:
- Primary metals orders increased 2.0% to $29.5 billion
- Fabricated metal products increased 3.5% to $44.5 billion
- Machinery increased 0.7% to $42.2 billion
- Computers and electronic products decreased 0.7% to $29.7 billion
- Electrical equipment, appliances and components increased 0.5% to $18.5 billion
- Furniture and related products decreased 0.8% to $7.5 billion
Shipments of manufactured durable goods increased 0.6% to $324.5 billion after a 0.8% March increase. Transportation equipment led the gain, up 0.8% to $107.8 billion.
Unfilled orders for manufactured durable goods increased 1.7% to $1.57 trillion, with transportation equipment up 2.4% to $993.1 billion. Inventories of manufactured durable goods increased 0.3% to $598.9 billion, led by a 0.4% increase in transportation equipment.
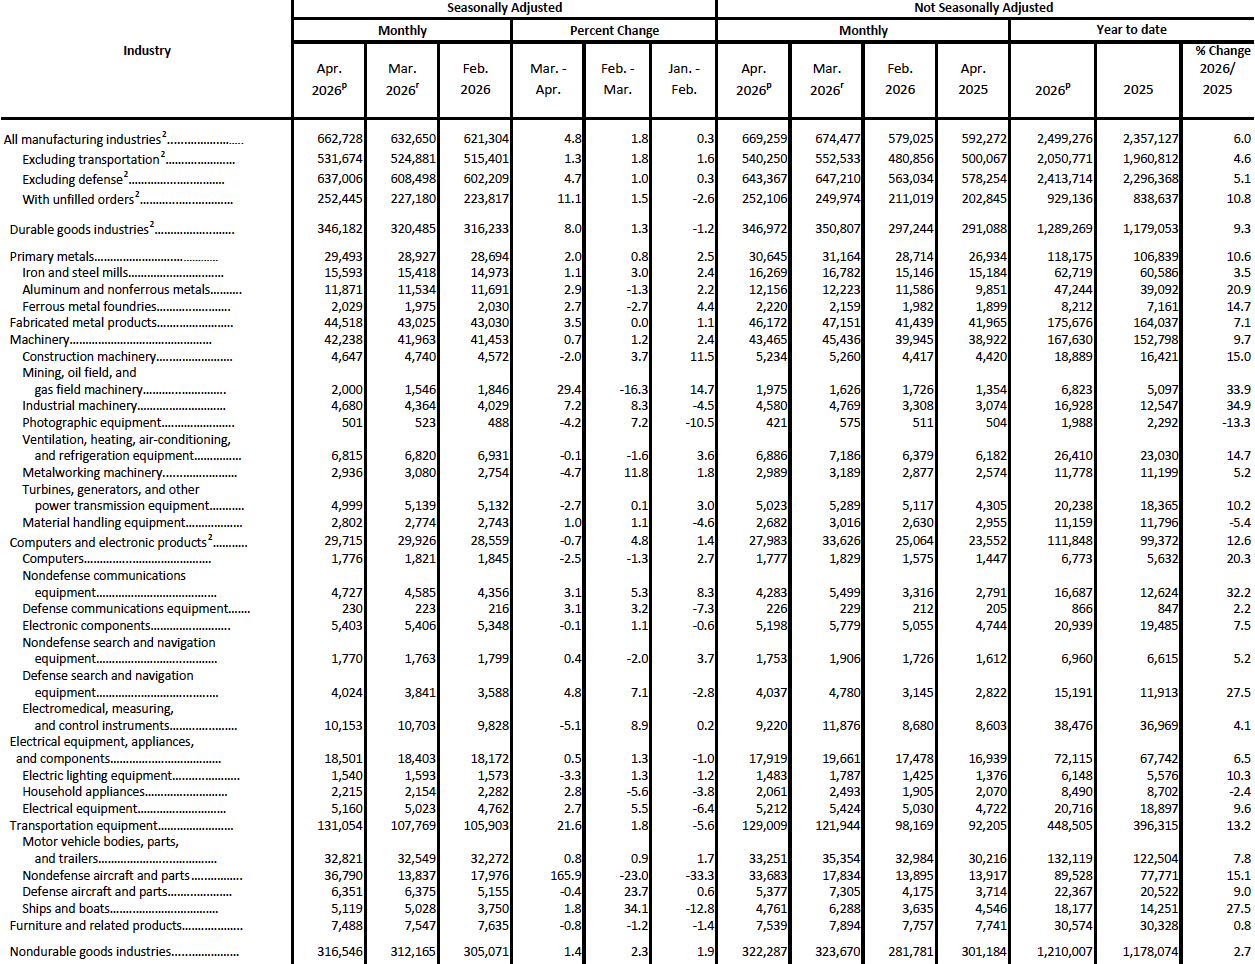
See the Bureau’s data for manufactured goods orders below:
(Click the chart for a larger version)
Nondurable goods
New orders for manufactured nondurable goods increased 1.4% in April to $316.5 billion.
Shipments of nondurable goods likewise increased 1.4% to $316.5 billion after a 2.3% March increase. Petroleum and coal products led the gain, up $2.5 billion, or 4.0%, to $64.7 billion.
Inventories of manufactured nondurable goods increased 0.2% to $360.2 billion after a 1.3% March increase. Chemical products led the increase, up 0.2% to $129.2 billion following eight consecutive monthly decreases.
See the Bureau’s full April Manufactured Goods Report here.
Related Posts
-

Surging energy prices continue to skew top-line CPI results, while core inflation was above market…
-

The infrastructure supplies distributor’s former CEO has retired as executive chairman, and the company has…
-

We break down the latest key figures out of the Census Bureau’s December report that…