The U.S. Census Bureau released its monthly construction spending report on Oct. 1, covering data for August 2026.
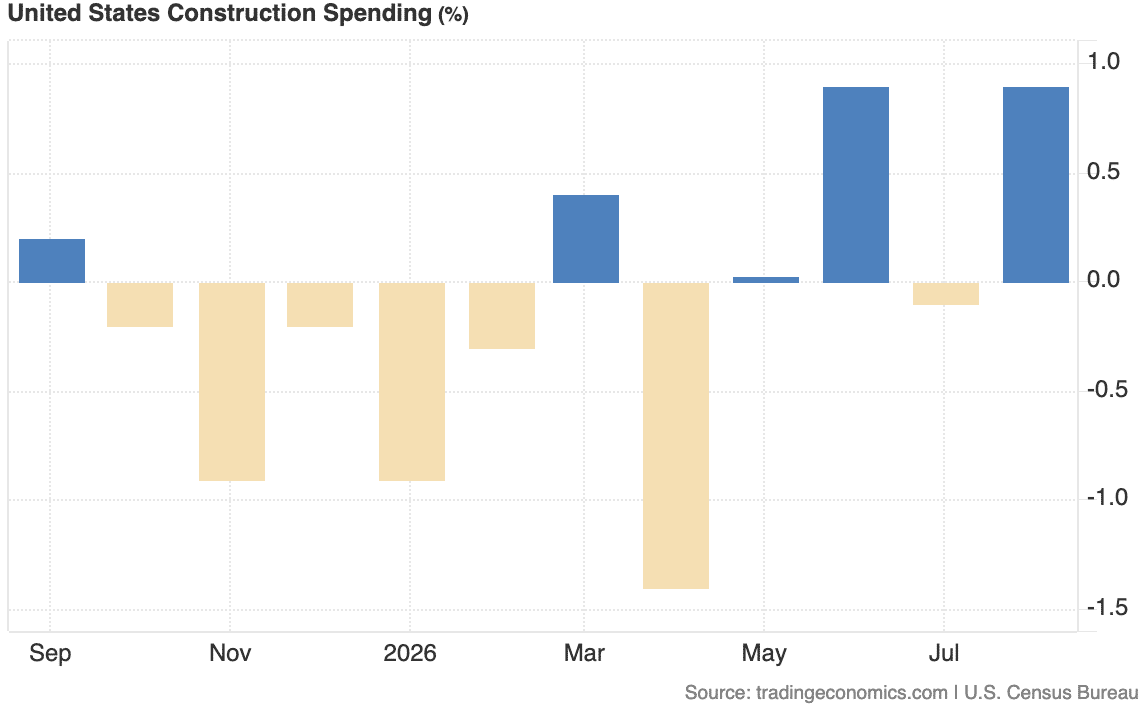
The report shared that August total construction spending was estimated at a seasonally adjusted annual rate of $2.203 trillion — 0.9% above the revised July estimate and down 1.7% year-over-year.
The August figure well exceeded market expectations of a flat reading and followed a downwardly revised 0.1% decrease in July (from 0.5%).
Through the first eight months of 2026, total construction spending of $1.45 trillion was 3.1% below the same period in 2025.
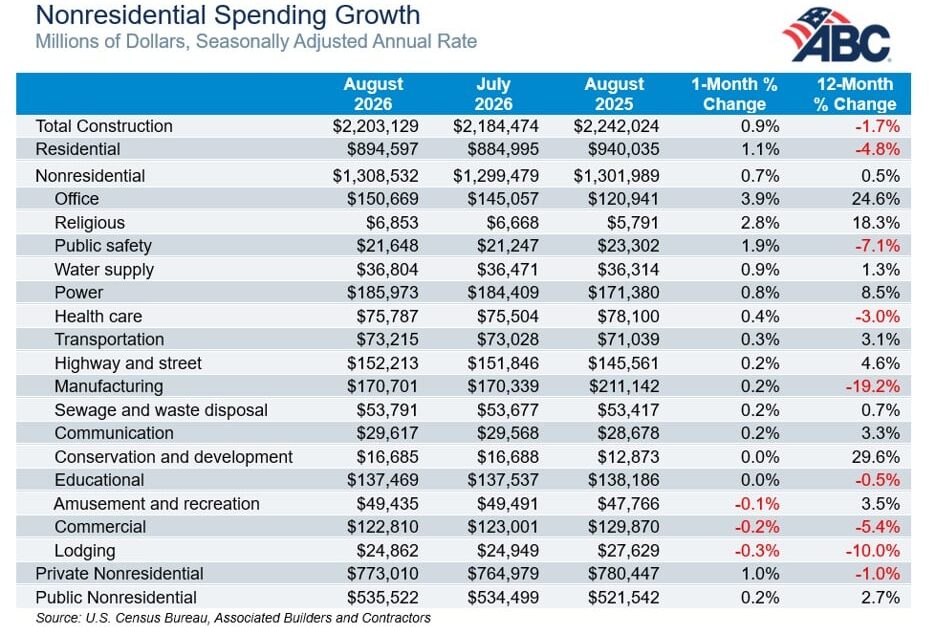
August residential construction spending was at a seasonally adjusted annual rate of $894.6 billion — up 1.1% above the revised July estimate and down 4.8% year-over-year.
August nonresidential construction spending was at a seasonally adjusted annual rate of $1.308.5 trillion — up 0.7% from the revised July estimate and up 0.5% year-over-year. It was the fifth straight monthly increase.
- Nonresidential spending increased month-over-month in 11 of the Bureau’s 16 subcategories, led by office (most of which came from data centers) at 3.9%. That subcategory ended August up 24.6% year-over-year. Manufacturing increased 0.2% month-over-month — marking its first monthly increase since January — and was down 19.2% year-over-year. Two subcategories were flat month-over-month, and three declined.
- “Frankly, it’s becoming difficult to contextualize the size and speed of this boom,” Associated Builders and Contractors Chief Economist Anirban Basu said in the firm’s analysis. “Data center construction spending leapt another 7.5% in August and is now up more than 73% over the past 12 months. The increases have been particularly large over the past four months, with data center spending increasing at an incredible 149% annualized pace since March. Despite this broad improvement, momentum will likely remain confined to the data center and power categories in the months to come,” said Basu. “Materials and labor cost escalation have reemerged during the second half of 2026, and the recent surge in Treasury yields will continue to put upward pressure on borrowing costs.”
Private Construction
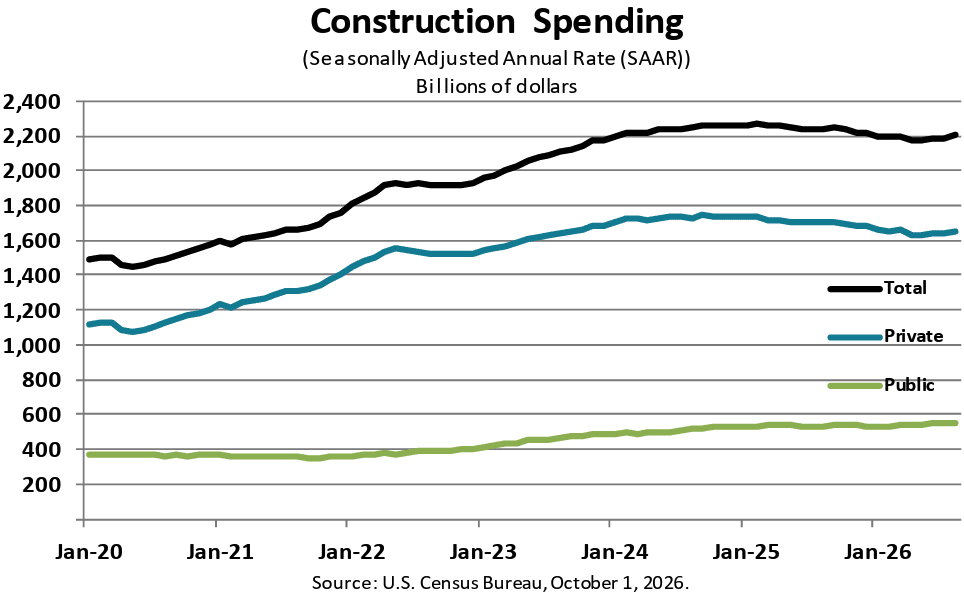
August total private construction spending was at a seasonally adjusted annual rate of $1.655 trillion — 1.1% above the revised July estimate and down 3.1% year-over-year.
- Private residential spending was at a seasonally adjusted annual rate of $882.3 billion — up 1.1% month-over-month and down 4.8% year-over-year.
- Single-family spending’s annual rate of $403.3 billion was up 0.2% month-over-month and down 3.5% year-over-year
- Multifamily spending’s annual rate of $115.8 billion was up 0.2% month-over-month and down 0.6% year-over-year
August private nonresidential construction spending was at a seasonally adjusted annual rate of $773.0 billion — up 1.0% month-over-month and down 1.0% year-over-year.
- Spending increased month-over-month in seven of the Bureau’s 11 subcategories, led by office at 4.6%. That subcategory ended August up 29.8% year-over-year on the strength of its data center component. Manufacturing was flat month-over-month and down 19.8% year-over-year. Three subcategories declined month-over-month.
Public Construction
August total public construction spending was at a seasonally adjusted annual rate of $547.8 trillion — 0.2% above the revised July estimate and up 2.5% year-over-year.
- Residential spending was at a seasonally adjusted annual rate of $12.3 billion —up 0.3% month-over-month and down 5.9% year-over-year
- Nonresidential spending was at a seasonally adjusted annual rate of $535.5 trillion — up 0.2% month-over-month and up 2.7% year-over-year
- Spending increased month-over-month in seven of the Bureau’s 12 subcategories, led by public safety at 1.5%. One subcategory was flat and four declined.
Related Posts
-

U.S. construction spending edged higher in May, helpeThe monthly dip came as non-data center commercial…
-
U.S. construction spending edged higher in May, helped by continued public sector gains and residential…
-

Solid housing construction spend more than offset a second straight nonres decline. Get the full…