
All charts by U.S. Bureau of Economic Analysis. Click on charts for hi-res version.
The U.S. economy grew faster to open 2026 than previously reported, according to final 1Q data released June 25 by the U.S. Bureau of Economic Analysis, while wholesale trade was one of the leading headwinds on the topline figure.
BEA’s third estimate showed that real gross domestic product increased at an annual rate of 2.1% in January-March. That was up from the Bureau’s second estimate of 1.6% growth released May 28, and slightly above the 2.0% advance estimate released April 30.
The final figure marked a sharper acceleration from 4Q25, when real GDP increased 0.5%.
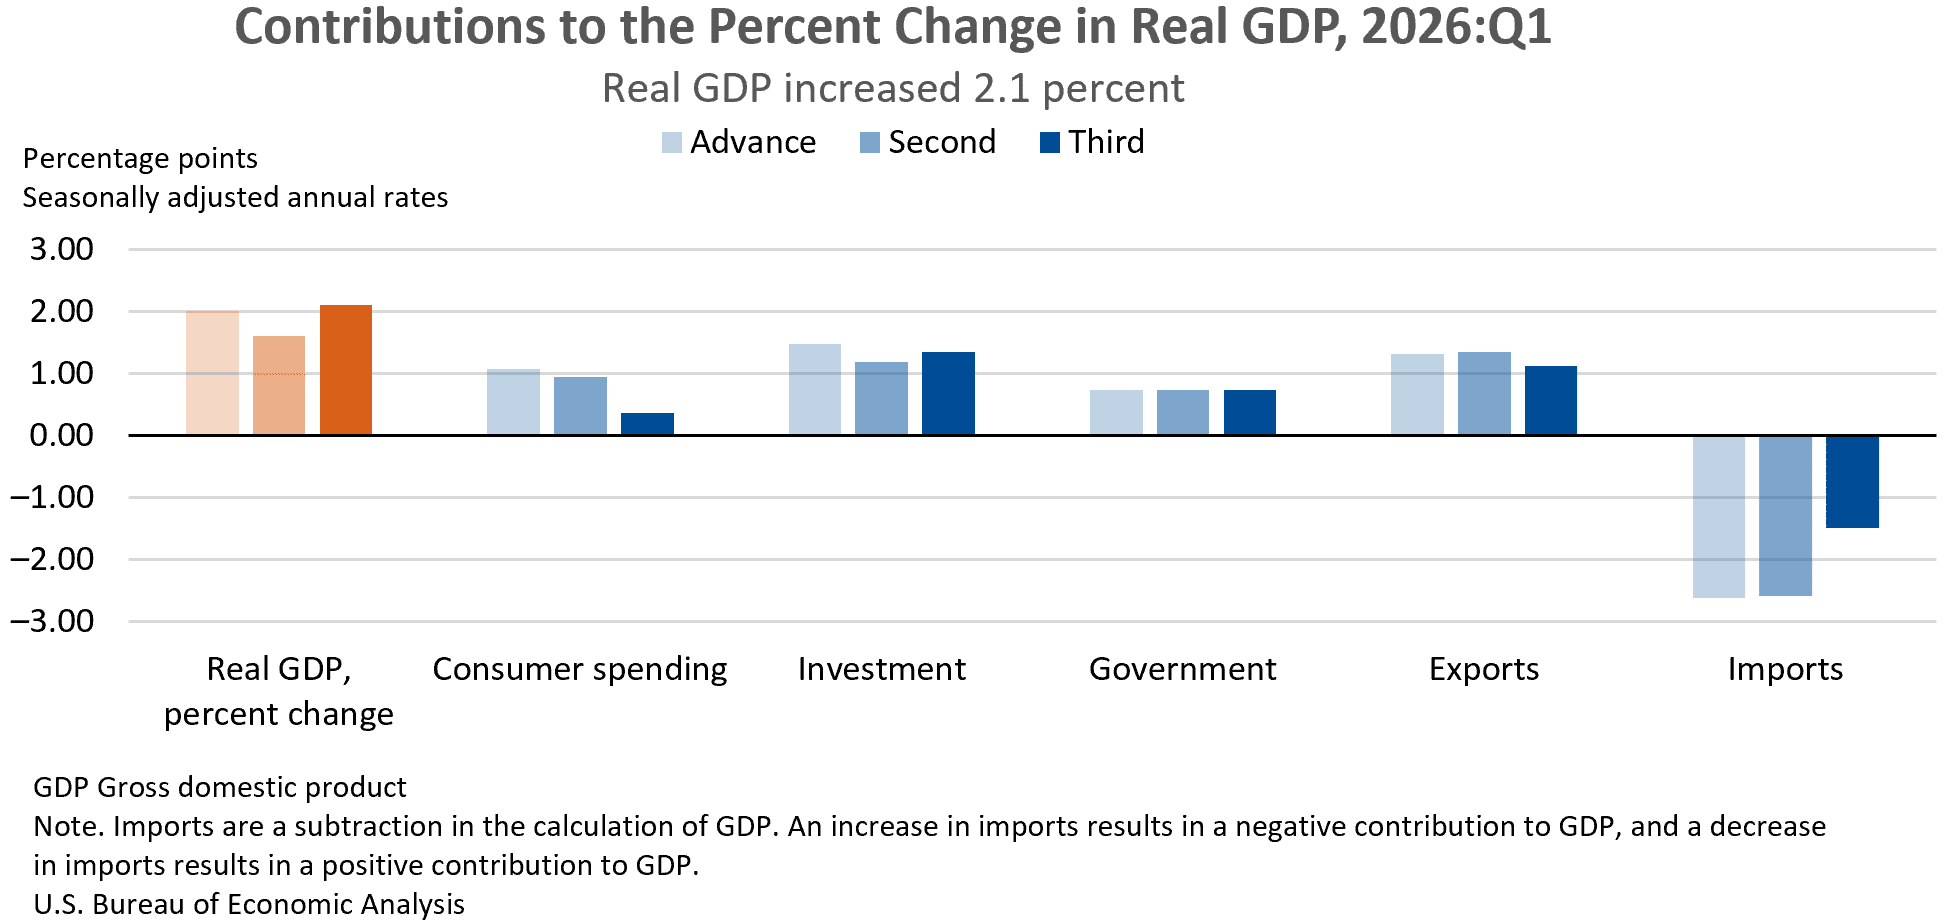
BEA said the 0.5-percentage-point upward revision primarily reflected a downward revision to imports, which are subtracted in the calculation of GDP. That was partly offset by a downward revision to consumer spending.
Within imports, BEA said the revision reflected lower estimates for both goods and services, led by consumer goods, capital goods and transport services. The downward revision to consumer spending primarily reflected lower estimates for financial services and insurance, as well as other services, led by international travel.
The contributors to 1Q GDP growth were investment, exports, government spending and consumer spending. Imports increased during the quarter, weighing on the topline figure.
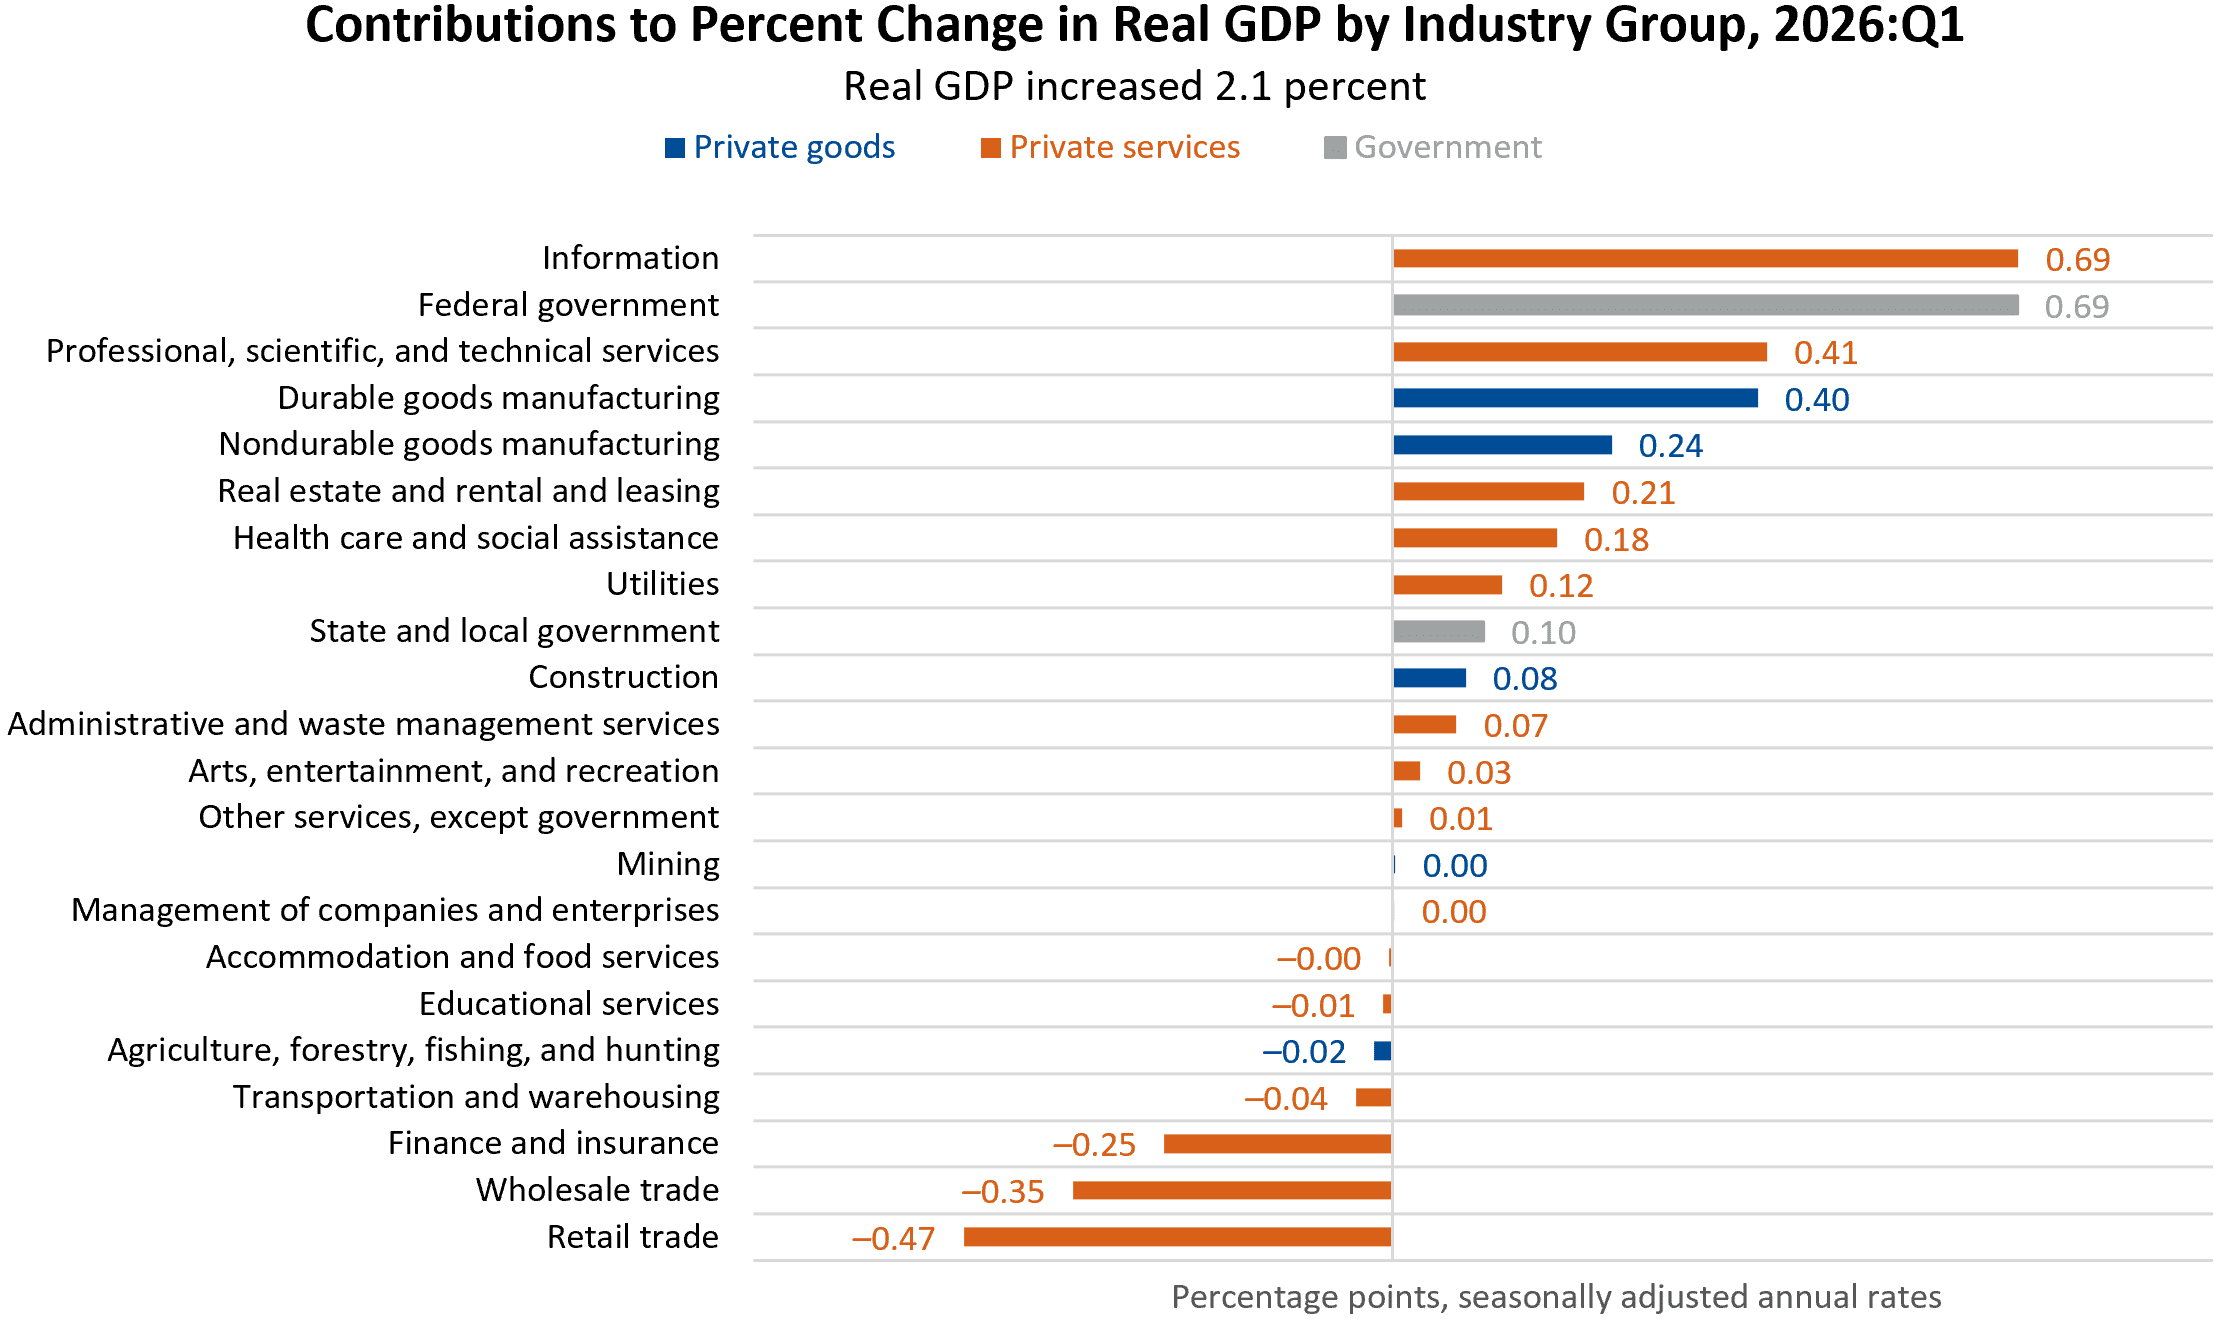
From an industry perspective, BEA said real value added increased 7.5% for government, 4.5% for private goods-producing industries and 0.8% for private services-producing industries. The leading contributors to GDP growth were information, federal government, professional, scientific and technical services and durable goods manufacturing. The leading offsets were retail trade (-0.47 percentage points), wholesale trade (-0.35) and finance and insurance (-0.25).
Real final sales to private domestic purchasers — the sum of consumer spending and gross private fixed investment — increased 1.7% in 1Q, revised down from the previous estimate of 2.4%.
The price index for gross domestic purchases increased 3.6%, revised up from 3.5%. The PCE price index increased 4.6%, revised up from 4.5%, while the PCE price index excluding food and energy held at 4.4%.
Real GDP and Related Measures
(% change from 4Q25 to 1Q26)
| Measure | 1Q 1st Estimate | 1Q 2nd Estimate | 1Q 3rd Estimate |
|---|---|---|---|
| Real GDP | 2.0% | 1.6% | 2.1% |
| Current-dollar GDP | 5.6% | 5.1% | 5.8% |
| Real final sales to private domestic purchasers | 2.5% | 2.4% | 1.7% |
| Gross domestic purchases price index | 3.6% | 3.5% | 3.6% |
| PCE price index | 4.5% | 4.5% | 4.6% |
| PCE price index excluding food & energy | 4.3% | 4.4% | 4.4% |
MDM Analysis
The final 1Q GDP estimate looks stronger at the topline, but it is not an across-the-board upgrade in demand conditions. The upward revision was driven mostly by a lower imports estimate rather than stronger domestic spending. That matters for distributors because imports can distort GDP readings, especially when customers are adjusting purchasing behavior, inventory timing and sourcing strategies around tariff, pricing or supply-chain uncertainty.
The more relevant signal is softer. Consumer spending was revised down, real final sales to private domestic purchasers slowed to 1.7%, and both wholesale trade and retail trade were leading industry offsets. For distributors, the takeaway is that early-2026 growth remained positive but uneven. Industrial production-linked activity and durable goods manufacturing were supportive, but customer demand, inventory discipline and margin management remain areas to watch closely entering 2Q.
Related Posts
-

The U.S. economy grew slower in early 2026 than first reported, as downward revisions to…
-

Government spending and private investment increased sequentially, and AI-related spending helped drive strong growth in…
-

The company’s Innovative Pumping Solutions segment continues to see substantial year-over-year expansion.