The U.S. Census Bureau released its monthly wholesale trade report on Feb. 24, reflecting results through December, which showed a second straight solid month of sales gains and a new annual high-water mark for the industry.
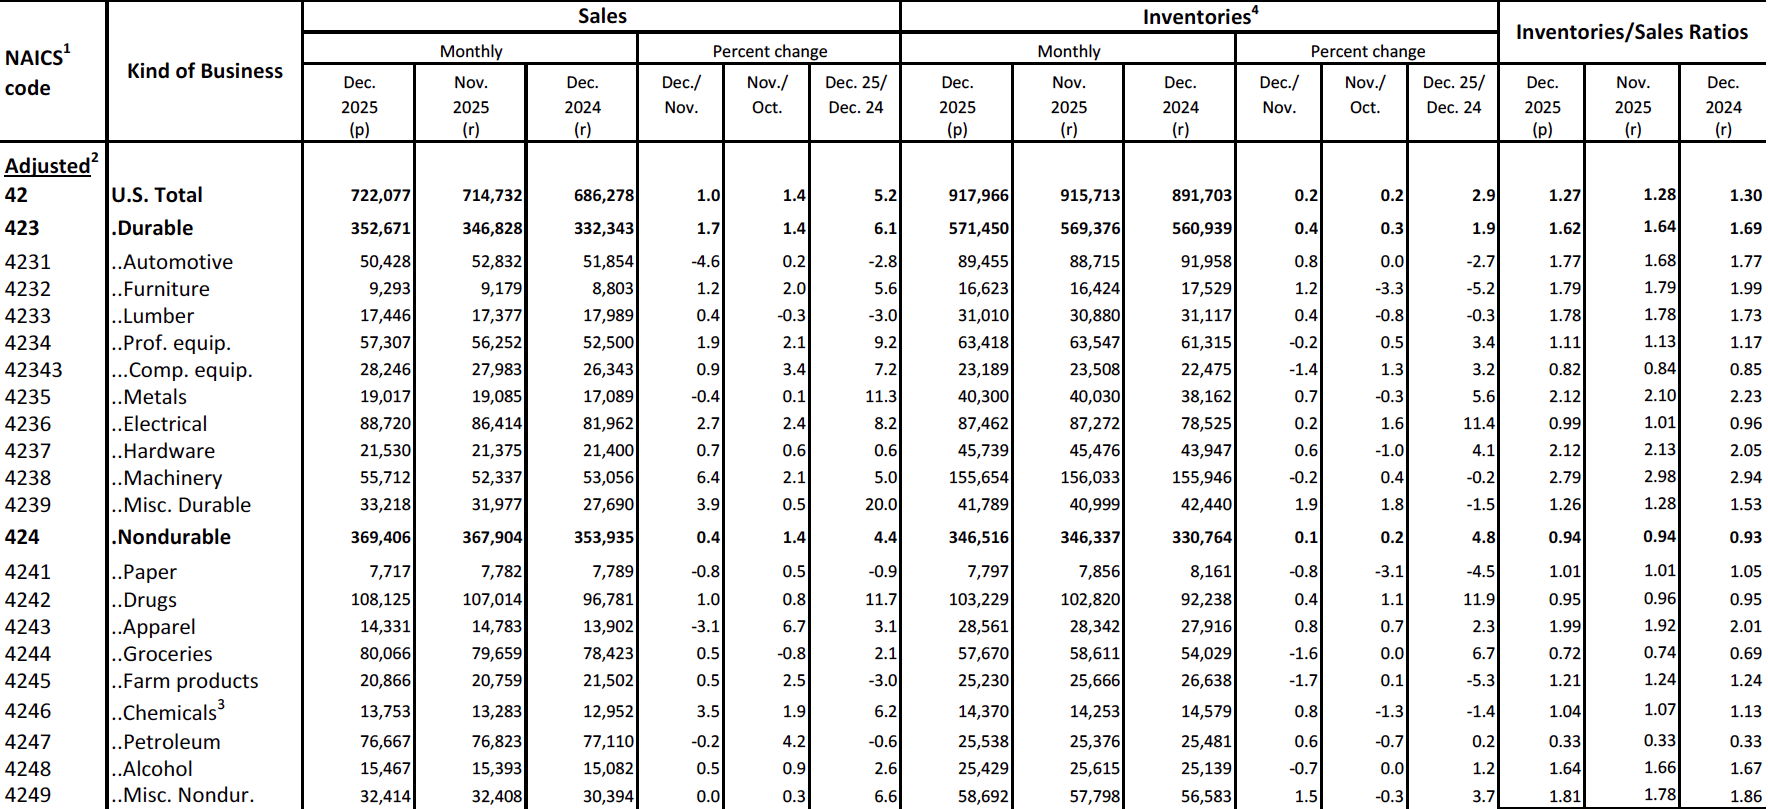
The report showed that December sales of merchant wholesalers — except manufacturers’ sales branches and offices, after adjustments or seasonal variations and trading day differences, but not for price changes — were $722.1 billion, up 1.0% from November’s figure that was revised up to +1.4% (from 1.3%) and up 5.2% year-over-year.
It was a strong end to the year for the industry after a 0.4% decline in October.
MDM’s 1Q26 Forecast Report (Premium access) – Updated Feb. 24
Within wholesale sales, December durable goods sales increased 1.7% after a 1.4% November increase (revised up from +1.2%), while nondurable sales improved 0.4% after a 1.4% November increase (revised down from +1.4%).
For the full year, U.S. wholesale trade sales ended 2025 at $8.442 trillion — up 4.8% vs. 2024. Durable goods sales of $4.1 trillion improved 6.2% and nondurable goods sales of $4.34 trillion improved 3.4%.
Year-to-Date Wholesale Sales by Product Category
Here’s a year-to-date and year-over-year look at how wholesale sales fared by NAICS product category through December 2025.
Inventories & Inventory/Sales Ratio
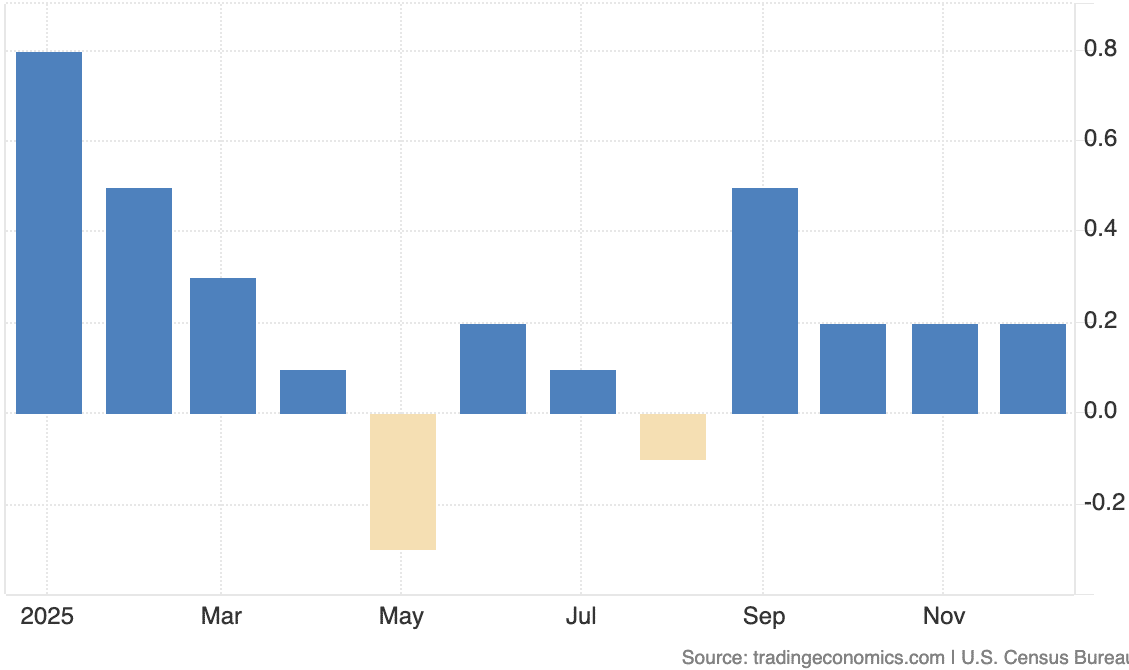
Meanwhile, wholesale inventories posted another increase during December, rising 0.2% for a third straight month and 2.9% YoY. December durable goods inventories rose 0.4% MoM (+1.9% YoY) after a 0.3% November increase, while nondurable inventories ticked up 0.1% MoM (+4.8% YoY) after a 0.2% November increase.
U.S. Wholesale Inventories Month-Over-Month % Change
The December inventories-to-sales ratio for wholesalers was 1.27, ticked down from November’s 1.28 1.28, down from and the 1.30 of a year earlier. In durable goods, the December ratio of 1.62 moved down from November’s 1.64 and the 1.69 of a year earlier, while the nondurable ratio of 0.94 held steady vs. November and was a tick ahead of the 0.93 of a year earlier.
And click on the chart below for a hi-res look at the Bureau’s December wholesale trade report figures for seasonally adjusted wholesale trade sales, inventories and inventories/sales ratios.