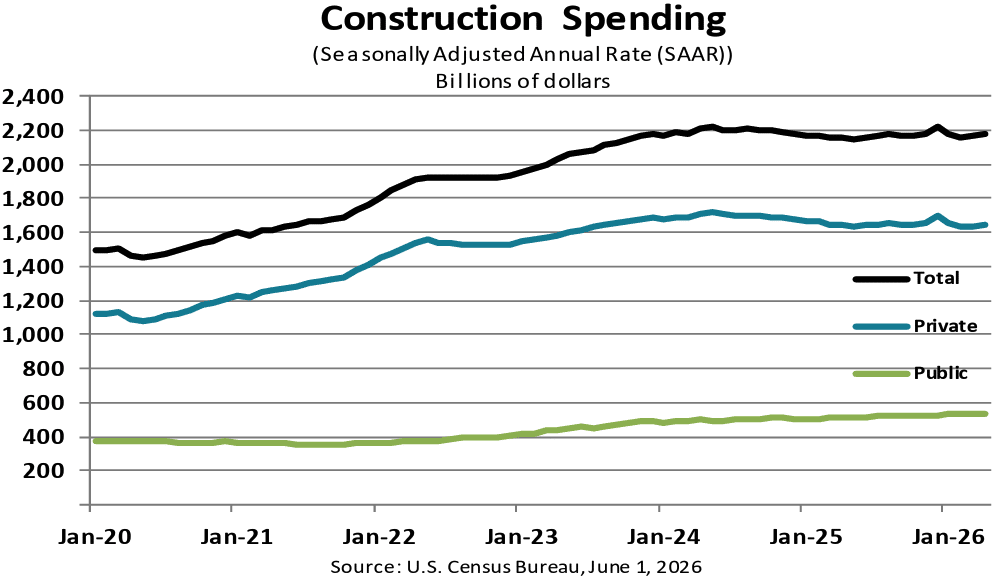
The U.S. Census Bureau released its monthly construction spending report on June 1, covering data for April 2026.
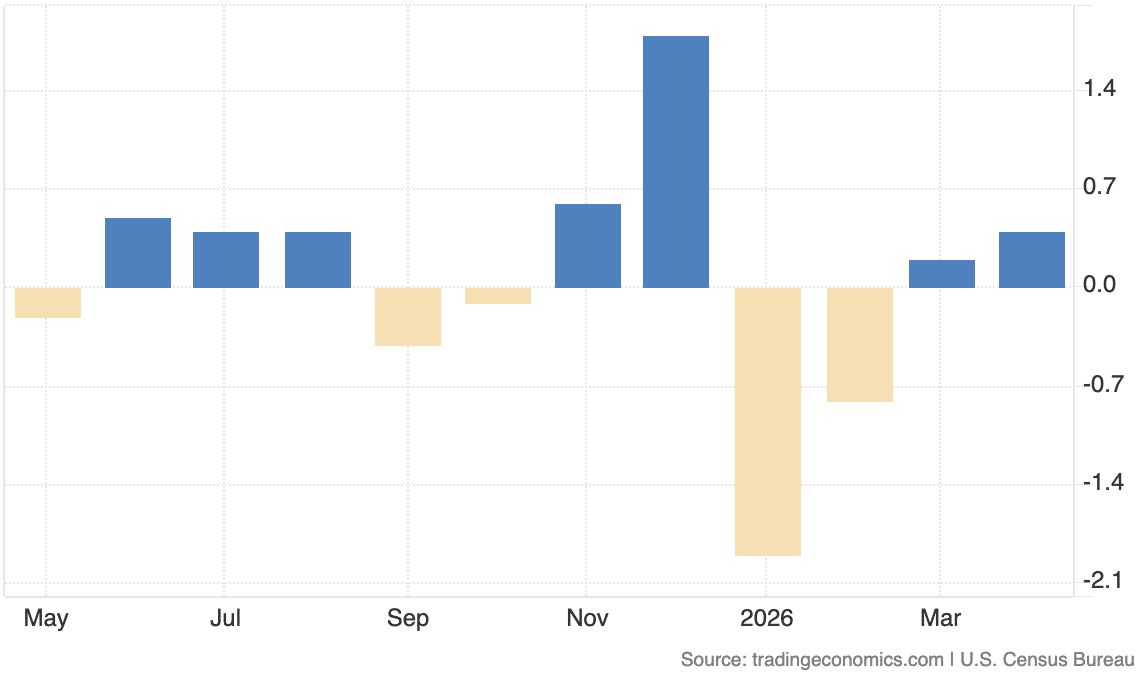
The Bureau’s report shared that April total construction spending was estimated at an adjusted annual rate of $2.172 trillion, up 0.4% from March’s revised mark and up 0.9% year-over-year. March’s gain was revised down from 0.6% to 0.2%.
The April acceleration topped market expectations of a 0.2% gain.
April private construction spending of $1.640 trillion was up 0.4% from March’s revised total and flat year-over-year, while public spending of $533 million was up 0.4% month-over-month and up 3.7% year-over-year.
Total U.S. Construction Spending: MoM % Change
Total residential spending of $922 billion was up 0.8% month-over-month and up 1.7% year-over-year, while total nonresidential spending of $1.250 trillion ticked up 0.1% month-over-month and up 0.3% year-over-year.
April nonres spending was up month-to-month in 10 of the Bureau’s 16 subcategories.
Private Construction — Residential vs. NonRes
Within April private construction spending, residential was up 0.8% month-to-month and nonresidential was down 0.2% — with the latter being its seventh straight decline. Within private nonres, spending was down in 3 of its 11 subcategories, led manufacturing at -1.2%. Private nonres spending has been in decline for nine consecutive quarters despite the influx of demand from data center construction.
Public Construction
Within public nonres construction, spending increased in eight of its 12 subcategories.